
Fig. 4
- ID
- ZDB-FIG-191014-10
- Publication
- Wang et al., 2019 - Inhibition of COX-2, mPGES-1 and CYP4A by isoliquiritigenin blocks the angiogenic Akt signaling in glioma through ceRNA effect of miR-194-5p and lncRNA NEAT1
- Other Figures
- All Figure Page
- Back to All Figure Page
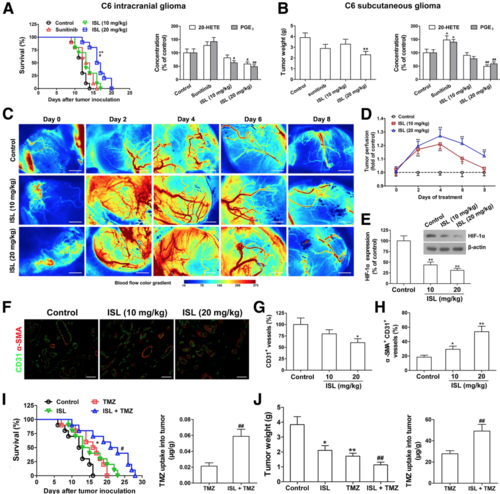
Isoliquiritigenin (ISL) prolongs survival, delays growth and induces vessel normalization in C6 gliomas with the decreased intratumoral level of 20-HETE and PGE2. a In the C6 intracranial glioma model, the survival time of the rats (n = 10) injected intraperitoneally with ISL (10 and 20 mg/kg), Sunitinib (80 mg/kg) or vehicle was measured, and 20-HETE and PGE2 in the tumor tissues from each group were determined at day 12 by LC-MS/MS or ELISA. b In the C6 subcutaneous glioma model, rat C6 glioma cells (5 × 10⁶) were injected subcutaneously into the right flank of Wistar rats. When tumors reached a size of about 100 mm3, the rats (n = 8) received ISL (10 and 20 mg/kg), Sunitinib (80 mg/kg) or vehicle by intraperitoneal injection once daily for a week. Tumor weight was measured, and 20-HETE and PGE2 were determined by LC-MS/MS or ELISA. The values are presented as the mean ± SEM, *P < 0.05, **P < 0.01 vs. control, #P < 0.05, ##P < 0.01 vs. sunitinib (80 mg/kg)-treated group. c-h Rat C6 glioma cells (5 × 10⁶) were injected subcutaneously into the right flank of Wistar rats. When tumors reached a size of about 100 mm3, the rats (n = 8) received ISL (10 and 20 mg/kg) or vehicle by intraperitoneal injection once daily for a week. Tumor perfusion at day 0, 2, 4, 6 and 8 was measured using a laser Doppler analyzer. Scale bars, 2 mm (c). The quantitative analysis showed the relative level of tumor perfusion (d). After sacrificing the rats at day 8, hypoxia induced factor (HIF)-1α in the tumor tissues was measured by Western blot (e). Double staining for CD31 (green) and α-SMA (red) in the tumor tissues was shown. Scale bars, 50 μm (f-h). i In the C6 intracranial glioma model, the survival time of the rats (n = 10) injected intraperitoneally with ISL (20 mg/kg), temozolomide (TMZ, 20 mg/kg), ISL (20 mg/kg) plus TMZ (20 mg/kg) or vehicle was measured, and TMZ uptake into tumor tissues was determined at day 12 by high performance liquid chromatography (HPLC). j In another experiment, rat C6 glioma cells (5 × 10⁶) were injected subcutaneously into the right flank of Wistar rats. When tumors reached a size of about 100 mm3, the rats (n = 8) received ISL (20 mg/kg), TMZ (20 mg/kg), ISL (20 mg/kg) plus TMZ (20 mg/kg) or vehicle by intraperitoneal injection once daily for a week. Tumor weight was measured, and TMZ uptake into tumor tissues was determined by HPLC. The values are presented as the mean ± SEM, *P < 0.05, **P < 0.01 vs. control, #P < 0.05, ##P < 0.01 vs. TMZ (20 mg/kg)-treated group |