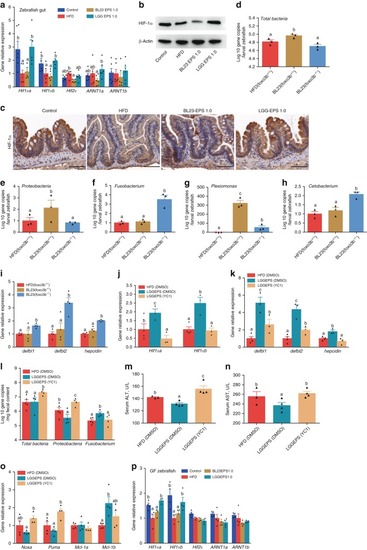
HIF1α-AMP axis contributed to the microbial homeostasis associated with LGG EPS in high-fat diet-fed zebrafish. a The expression of genes related to hypoxia-inducible factors in the intestines of zebrafish fed with different diets for 4 weeks as measured by q-PCR (n = 6, pool of three zebrafish per sample). b A representative western blotting showing the expression pattern of Hif1α in the intestines. c Intestinal Hif1α levels evaluated by immunohistochemical analysis, the scale bar is 50 μm. Foxo3b-null zebrafish larvae (foxo3b−/−) and their wild-type siblings (foxo3b+/+) were fed 1.0% BL23 EPS diet for 7 days. The total bacteria (d) and the relative bacterial abundance of Proteobacteria (e), Fusobacteria (f), Plesiomonas (g), Cetobacterium (h) of the microbiota of the foxo3b-null larvae and their wild-type siblings (n = 3, pool of 20 larvae per sample). The expression pattern of genes related to AMPs i in foxo3b-null larvae and their wild-type siblings as measured by q-PCR (n = 4, pool of 20 larvae per sample). The adult zebrafish fed 1.0% LGG EPS for 2 weeks received intraperitoneal injection of YC-1 (an HIF-1α inhibitor; APExBIO, B7641) in dimethyl sulfoxide (DMSO) (2 mg/kg) once every 2 days for another 6 days. The expression of HIF-1α (j), and AMPs (k), in intestines as measured by q-PCR (n = 3 or 4, pool of three zebrafish per sample). l The number of total bacteria, Proteobacteria, and Fusobacteria in intestinal contents of zebrafish (n = 4 or 5). Serum ALT (m) and serum AST (n) in zebrafsh. o The expression of apoptotic factors in intestines as measured by q-PCR (n = 4–6, pool of three zebrafish per sample). p The expression of genes related to hypoxia-inducible factors as measured by q-PCR in germ-free larvae fed with sterile control diet, high-fat diet (HFD), or HFD supplemented with 1.0% BL23 EPS or LGG EPS for 1 week (n = 4, pool of 20 larvae per sample). Data are expressed as the mean ± SEM. Graph bars labeled with different letters on top represent statistically significant results (P < 0.05), whereas bars with the same letter indicates non-significant differences
|
