
Fig. 4
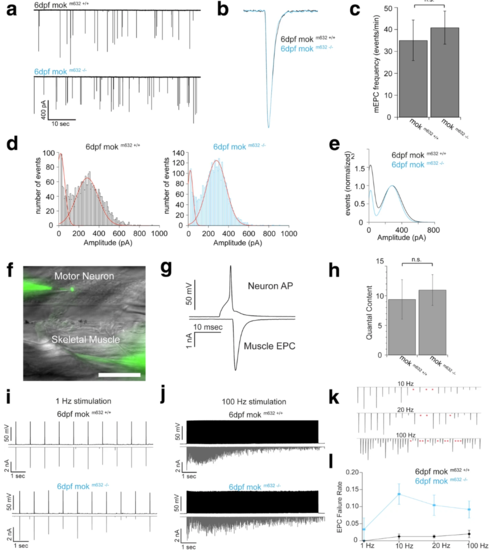
NMJ function is impaired by severely reduced levels of Dynactin1a. a Sample traces of spontaneous miniature end plate currents (mEPCs) from fast-twitch muscle fibers. b Normalized individual mEPCs from mok m632−/− larvae (blue trace) and their wild-type siblings (black trace). c Average mEPC frequency recorded from wild-type and mutant mok m632−/− larvae. dmEPC amplitude histogram for wild-type and mok m632−/− larvae with Gaussian functions (red traces). e Normalized Gaussian fits from wild-type (black trace) and mok m632−/− larvae (blue trace). f Paired motor neuron skeletal muscle fiber recording each patched and filled with AlexaFluor 488 (calibration bar = 100um). g Motor neuron action potential is evoked by a 2 msec current injection (upper trace) and subsequent muscle EPC is recorded (lower trace). h Average quantal content (evoked EPC amplitude/mEPC amplitude for wild-type and mok m632−/− larvae. Sample traces from paired neuron – muscle whole cell recordings for wild-type and mok m632−/− larvae with stimulus frequencies of i 1 Hz and j 100 Hz. k Magnification of evoked EPCs from mok m632−/− larvae recordings demonstrating postsynaptic EPC failures occurring at 10, 20 and 100 Hz (red asterisks). l Evoked EPC failure rate is significantly higher in mok m632−/− (blue trace) than in wild-type larvae (black trace) for paired recordings 10 Hz, 20 Hz and 100 Hz. Data shown as mean +/−SEM. (c: average = 35.04 ± 9.25, n = 2638 events from 15 fish/ average = 40.86 ± 7.53, n = 4903 events from 24 fish; d: n = 2638 events from 15 fish/ n = 4903 events from 24 fish; d: WT peak 1 average = 18.35, WT peak 2 average = 283.19, mutant peak 1 average = 20.42, mutant peak 2 average = 280.00; h: QC = 9.39 ± 3.31, n = 8 pairs/ QC = 10.98 ± 2.59, n = 18 pairs; l: n = 8 pairs/ n = 9 pairs) |
| Fish: | |
|---|---|
| Observed In: | |
| Stage: | Day 6 |