
Fig. 2
- ID
- ZDB-FIG-190730-7
- Publication
- Andalman et al., 2019 - Neuronal Dynamics Regulating Brain and Behavioral State Transitions
- Other Figures
- All Figure Page
- Back to All Figure Page
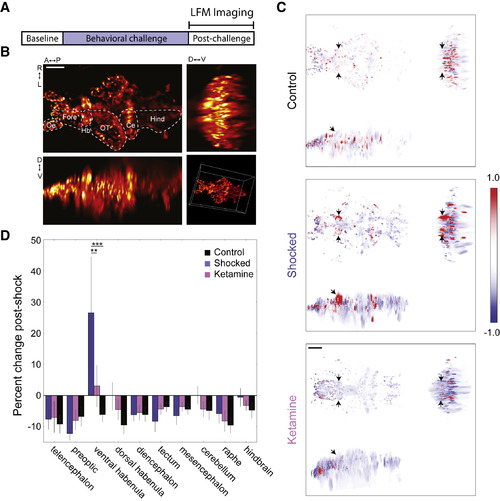
Whole-Brain Ca2+ Imaging Using LFM: Unique vHb Hyperactivityfollowing BC (A) LFM was used to measure GCaMP6s Ca2+ signals during a 45-min post-BC period. (B) Orthogonal maximum intensity projections of a LFM volume (scale bar, 50 μm). Hb, habenula; OT, optic tectum; Fore, forebrain; Oe, olfactory epithelium; Ce, cerebellum; Hind, hindbrain. See also Figure S2. (C) Orthogonal min-max projections of volumes showing the change in fluorescence over the post-BC period in a representative fish from the control group (top), shocked group (middle); and ketamine group (bottom). Red and blue indicate an increase and decrease in fluorescence, respectively (arbitrary units; black arrows show the location of the vHb; scale bar, 50 μm). (D) Change in average fluorescence over the post-BC period. Shocked fish showed an increase in vHb activity (blue, n = 6) compared to control fish (black, n = 4; p = 0.0002, two-way repeated-measures ANOVA with Tukey HSD post hoc comparison). This effect was reduced in shocked fish that were previously treated with ketamine (pink, n = 8; p = 0.0014). |
Reprinted from Cell, 177(4), Andalman, A.S., Burns, V.M., Lovett-Barron, M., Broxton, M., Poole, B., Yang, S.J., Grosenick, L., Lerner, T.N., Chen, R., Benster, T., Mourrain, P., Levoy, M., Rajan, K., Deisseroth, K., Neuronal Dynamics Regulating Brain and Behavioral State Transitions, 970-985.e20, Copyright (2019) with permission from Elsevier. Full text @ Cell