
- Title
-
Neuronal Dynamics Regulating Brain and Behavioral State Transitions
- Authors
- Andalman, A.S., Burns, V.M., Lovett-Barron, M., Broxton, M., Poole, B., Yang, S.J., Grosenick, L., Lerner, T.N., Chen, R., Benster, T., Mourrain, P., Levoy, M., Rajan, K., Deisseroth, K.
- Source
- Full text @ Cell
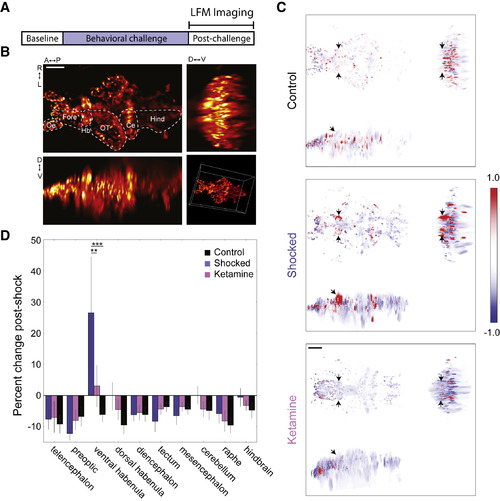
Whole-Brain Ca2+ Imaging Using LFM: Unique vHb Hyperactivityfollowing BC (A) LFM was used to measure GCaMP6s Ca2+ signals during a 45-min post-BC period. (B) Orthogonal maximum intensity projections of a LFM volume (scale bar, 50 μm). Hb, habenula; OT, optic tectum; Fore, forebrain; Oe, olfactory epithelium; Ce, cerebellum; Hind, hindbrain. See also Figure S2. (C) Orthogonal min-max projections of volumes showing the change in fluorescence over the post-BC period in a representative fish from the control group (top), shocked group (middle); and ketamine group (bottom). Red and blue indicate an increase and decrease in fluorescence, respectively (arbitrary units; black arrows show the location of the vHb; scale bar, 50 μm). (D) Change in average fluorescence over the post-BC period. Shocked fish showed an increase in vHb activity (blue, n = 6) compared to control fish (black, n = 4; p = 0.0002, two-way repeated-measures ANOVA with Tukey HSD post hoc comparison). This effect was reduced in shocked fish that were previously treated with ketamine (pink, n = 8; p = 0.0014). |

2P Imaging of Cellular-Resolution Brainwide Responses during BC Reveal the Dynamics of Experience-Encoding Activity in the vHb (A) Head-fixed volumetric 2P calcium imaging during BC while monitoring tail movement. (B) Diagram of imaged brain area (yellow rectangle). (C) Head-fixed fish exhibit a reduction in tail movement rate as a result of BC (black: control, n = 6; blue: shocked, n = 8; p = 0.030, one-sided Student’s t test). Prior exposure to acute ketamine eliminates this response (pink, n = 4, p = 0.283, n.s.). (D) Regressor consisting of linearly rising activity following the onset of shocks was used to search for cells with activity correlated to the extent of BC. (E) Example of the fit between the regressor and the Δf/f Ca2+ trace for four neurons (bottom; locations at top; black dashed line indicates start of shocks). (F) Region of interest (ROI) of each neuron colored by the correlation (r) between its Δf/f Ca2+ trace and the regressor (scale bar, 25 μm). See also Figure S3. (G) Average baseline-subtracted Δf/f response for all neurons in each of several brain regions (see also Figure S4). In the vHb, the average activity over the final 2 min was increased in shocked fish (n = 8) compared to control (n = 6) and ketamine-treated (n = 4) fish (p = 0.0189 and p = 0.0432, respectively; two-way repeated-measures ANOVA with Tukey HSD post hoc comparison). Shocked fish also showed a decrease in raphe activity (p = 0.012 and p = 0.007) and dorsal thalamus activity (p = 0.007 and p = 0.006) compared to controls and ketamine-treated fish. (H) Example of MultiMAP registration to identify serotonergic neurons in the superior raphe (see STAR Methods). (I and J) Raster plot of baseline-subtracted Δf/f activity of all 5-HT+ neurons (I) (n = 158 neurons from 3 fish) and 5-HT– neurons (J) (n = 332 neurons) sorted based on hierarchical clustering with top 8 flat clusters demarcated by coloring scheme of left. 5-HT+ neurons, on average, exhibited a significantly larger response to BC onset compared to 5-HT– neurons (60-s window following onset; p = 0.026, paired Student’s t test) and compared to 5-HT+ neurons in non-shocked controls (n = 4 non-shocked control fish; p = 0.027, Student’s t test). 5-HT– neurons did not have a significant response to BC onset (p = 0.37, Student’s t test). |
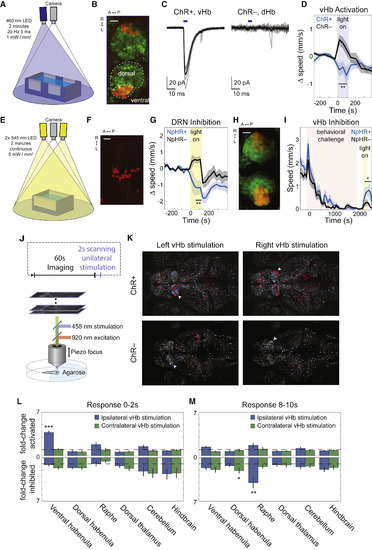
Optogenetic Activation of vHb Causally Evokes Passive-State Behavior and Brainwide Activity Dynamics (A) Rig used to activate ChR in free-swimming fish. (B) Max-projection of confocal stack of Hb in 15 dpf Tg(ppp1r14ab:Gal4-VP16; UAS:ChR2-mCherry;elavl3:h2b-GCaMP6s) showing expression pattern of ppp1r14ab (red) on elavl3 background (green; scale bar, 25 μm; see also Figure S6A). (C) Inward photocurrents in an in vivo voltage-clamped ChR2-mCherry+ vHb neuron (left) and ChR2-mCherry– dHb neuron (right), evoked by 5-ms pulses of 475-nm light (blue bars; average response indicated by solid black line, n = 6 ChR+ pulses, 8 ChR– pulses). (D) Baseline-subtracted speed of ChR+ fish, Tg(ppp1r14ab:Gal4-VP16; UAS:ChR2-mCherry) (blue, n = 10), and ChR– clutch mates (black, n = 11) in response to 2 min of 20 Hz 460-nm light pulses (5 ms duration; 1 mW/mm2; 4-min baseline). During stimulation, the ChR+ fish showed reduced speed compared to ChR– fish (p = 0.0038) and compared to baseline (p = 0.048, paired Student’s t test). In contrast, the visible blue light caused ChR– fish to show an increase in speed (p = 0.040, paired Student’s t test). See also Figure S6B. (E) Rig used to activate NpHR in free-swimming fish. (F) Max-projection of 2P stack of superior raphe in 13 dpf Tg(tph2:Gal4ff; UAS:NpHR-mCherry) (scale bar, 25 μm). (G) Baseline-subtracted speed of NpHR+ fish, Tg(tph2:Gal4ff; UAS:NpHR-mCherry) (blue, n = 11), and NpHR– clutch mates (black, n = 10) in response to 2 min of continuous 545-nm light (5 mW/mm2; 4-min baseline). NpHR+ fish showed reduced speed during the second minute of inhibition compared to baseline (p = 0.039, paired Student’s t test) as well as compared to NpHR– fish (p = 0.0039). In contrast, the visible yellow light caused NpHR– fish to show an increase in speed (p = 0.013, paired Student’s t test). (H) Max-projection of confocal stack of Hb in 15 dpf Tg(dao:Cre-mCherry; vglut2a:loxP-DsRed-loxP-GFP) showing GFP expression in dao+ and vglut2a+ cells (red) and DsRed in other vglut2a+ cells (green) (scale bar, 25 μm). (I) Speed of NpHR+ Tg(dao:Gal4-VP16; UAS:NpHR-mCherry) fish (blue, n = 8) and NpHR– clutch mates (black, n = 10) in response to BC followed by 2 min of continuous 545-nm light (5 mW/mm2). NpHR+ fish showed a significantly larger increase in speed than NpHR– fish during the second minute of inhibition and the 2 min following stimulation (p = 0.034). Both the NpHR+ and NpHR– cohorts showed a significant increase in speed compared to the 4-min baseline period prior to light onset (p = 0.009 and p = 0.027, respectively; paired Student’s t test). (J) 2P Ca2+ imaging of the response to unilateral one-photon laser scanning stimulation of the vHb. (K) Max projection of ChR+ and ChR– fish (site of stimulation indicated by white arrows). ROIs of the neurons with a significant response to simulation (p < 0.05, see STAR Methods) are colored red if activated and blue if inhibited. (L) Fold-change in the fraction of neurons that showed a significant excitatory response in the 2 s following stimulation in ChR+ fish (n = 6) compared to ChR–fish (n = 4) in several regions both ipsilateral and contralateral to the site of stimulation (top). The analogous plot for inhibitory responses (bottom). The ipsilateral vHb showed a significant activation (p = 0.00002). See also Figure S6D. (M) Analogous to (L) for the period 8–10 s following stimulation. The ipsilateral raphe showed a significant increase in the number of inhibitory responses during this period (p = 0.004), as did the contralateral dHb (p = 0.048). |
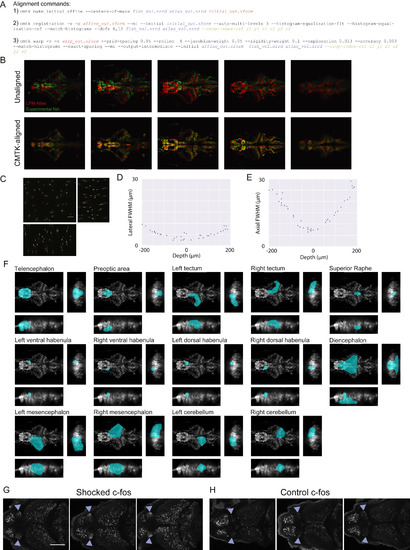
Registration and Resolution of LFM Volumes, Related to Figure 2 (A) The three Computation Morphometry Toolkit (CMTK) commands used to register LFM volumes to a common reference atlas. Input filenames for each command are displayed in blue text; output filenames are displayed in red text; and optional parameters are displayed in green text. (B) Five evenly spaced horizontal slices from a LFM volume of an experimental fish (green) and the LFM atlas (red) before (top) and after (bottom) non-rigid registration using CMTK. (C-E) Assessment of spatial resolution of LFM. (C) Orthogonal maximum intensity projections of a light field volumetric reconstruction of 1μm fluorescent beads embedded in 1% agarose (100 μm scale bar; xy projection in top left; 200 ms exposure time; 6.3 mW excitation light). (D and E) The lateral (D) and axial (E) full width at half maximum of individual fluorescent beads located at different depths within the volume displayed in panel C. These data provide an upper bound on the resolution of our LFM microscope because the Richarson-Lucy deconvolution algorithm is optimal suited for sparse samples such as a bead volume (Broxton et al., 2013, Shaked et al., 2011). For comparison, the theoretical diffraction-limited FWHM of the point spread function is 0.437 μm laterally and 3.176 μm axially when using 515 nm light and a 0.6 NA objective. (F) Atlas region masks (teal) are shown overlaid on orthogonal maximum intensity projections of the LFM atlas. (G and H) 2P stack of in situ hybridation for c-fos max-projected over 15 μm within the vHb in three fish 30 min after the end of BC with 5V shocks (G) and no shocks (H; 0V; blue triangle demarcate lateral edges of vHb; scale bar, 100 μm). |

2P Imaging of Brainwide Responses during BC, Related to Figures 3and 5 (A) Modified BC causes immobility in freely swimming fish. Fish that are exposed to 50 ms shocks delivered with a uniformly distributed random inter-shock interval between 15 and 25 s enter a reduced mobility state (n = 10; pink shading indicates shock period; p = 10−5, paired Student’s t test comparing average speed in 5 min pre-shock to 5 min post-shock). (B) Max-projection of two representative fish with the ROI of neurons with significant shock-triggered activation colored according to their Δf/f response (red and blue indicate positive and negative responses, respectively; see STAR Methods). Significant responses were distributed throughout the brain with clusters of large responses in the posterior portion of the vHb (white arrow on left) and the area lateral of the Neuropil Region 6 (white arrows on right). (C) Shock-triggered Δf/f response of significantly activated neurons in several anatomical regions throughout the brain. (D) Images displaying the fit between the regressor and the Δf/f Ca2+ trace for all neurons across all z-slices for five fish from the control, shocked, and re-exposed conditions. The ROI of each neuron is colored by the value of the Pearson correlation coefficient (r) between the regressor and its Δf/f calcium trace. The ROIs are rendered partially transparent (alpha = 0.2) such that all planes can be perceived. The control and shocked fish in the top row represent the same fish that are shown in Figure 3F for comparison. (E) Shocks activate vHb neurons. The shock-triggered average Δf/f trace of a vHb neuron. The time of shock is indicated by a dashed red line. To determine the significance of the shock-triggered response, 400 bootstrapped average responses were generated using randomized shock times (see STAR Methods). The shaded areas indicate s.e.m. of shock-triggered responses (green) and bootstraps (beige). (F) The percentage of neurons in the vHb that showed a significant shock-triggered activation in response to individual shocks was not significantly reduced by ketamine treatment in either the left or right hemisphere (p = 0.52 and 0.60, respectively, Student’s t test). The percentage of activated neurons was also not significantly different between the hemispheres in either the shocked, ketamine, or re-exposed conditions (p = 0.51, 0.66, and 0.28, respectively, paired Student’s t test). (G) The average baseline-subtracted Δf/f response for all vHb neurons separately for the left and right hemispheres in the control (left), shocked (center), and ketamine-treated (right) conditions. Activity was not significantly different between the two hemispheres (p = 0.81, p = 0.08, and p = 0.20, respectively, paired Student’s t test on activity in final two min). Shaded area and error bars are s.e.m. |
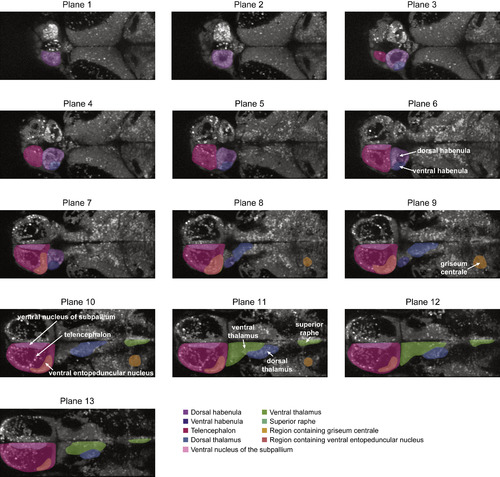
Anatomical Region Definitions for 2-Photon Imaging Data, Related to Figure 3 Dorsal habenula: violet; ventral habenula: purple; telencephalon: pink; dorsal thalamus: blue; ventral nucleus of the subpallium: teal; ventral thalamus: green; raphe nucleus (superior raphe: median and dorsal subdivisions): light green; region containing the griseum centrale: orange; region containing the ventral entopeduncular nucleus: peach. |
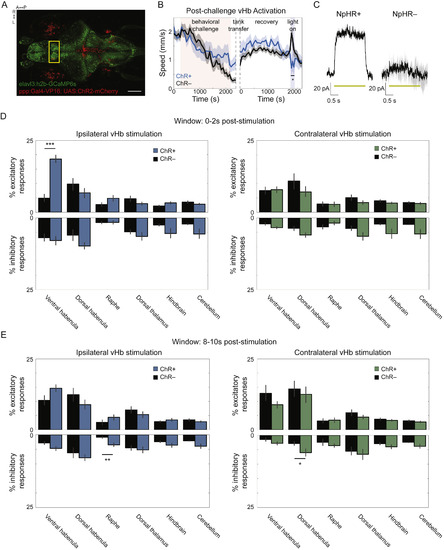
Brainwide Responses to vHb ChR Stimulation, Related to Figure 6 (A) Max-projection of confocal stack of 15 dpf Tg(ppp1r14ab:Gal4-VP16; UAS:ChR2-mCherry;elavl3:h2b-GCaMP6s) (scale bar = 150μm; yellow box demarcates region shown in Figure 6B). (B) The speed of ChR+ fish (blue, n = 9) and ChR– clutch mates (black, n = 16) in response to BC (left) followed by recovery in a visually distinct tank and then two minutes of 460 nm light pulses (20 Hz; 5 ms duration; 1 mW/mm2). ChR+ fish showed a significantly lower movement rate than ChR– fish during the stimulation period (p = 0.0184). (C) Outward photocurrents in an in vivo voltage-clamped mCherry+ vHb neuron from a Tg(dao:Gal4-VP16; UAS:NpHR-mCherry) fish (left) and mCherry– neuron from the same fish (right). Photocurrents were evoked by 2 s of 560 nm continuous light (yellow bars; average response indicated by solid black line; n = 3 pulses for both NpHR+ and NpHR–). (D) The percentage of cells in each fish that showed a significant excitatory (upper) or inhibitory (lower) response in the two seconds following stimulation in ChR+ fish (blue, n = 6) and ChR- fish (black, n = 4) in several regions both ipsilateral to stimulation (left) and contralateral (right). (E) The percentage of cells significantly responding 8-10 s post-stimulation. Error bars and shaded regions are s.e.m. All statistical tests are Student’s t tests unless otherwise indicated (∗p < 0.05; ∗∗p < 0.01; ∗∗∗p < 0.001). |
Reprinted from Cell, 177(4), Andalman, A.S., Burns, V.M., Lovett-Barron, M., Broxton, M., Poole, B., Yang, S.J., Grosenick, L., Lerner, T.N., Chen, R., Benster, T., Mourrain, P., Levoy, M., Rajan, K., Deisseroth, K., Neuronal Dynamics Regulating Brain and Behavioral State Transitions, 970-985.e20, Copyright (2019) with permission from Elsevier. Full text @ Cell