
Fig. S7
- ID
- ZDB-FIG-190725-84
- Publication
- Jeong et al., 2019 - A threonyl-tRNA synthetase-mediated translation initiation machinery
- Other Figures
- All Figure Page
- Back to All Figure Page
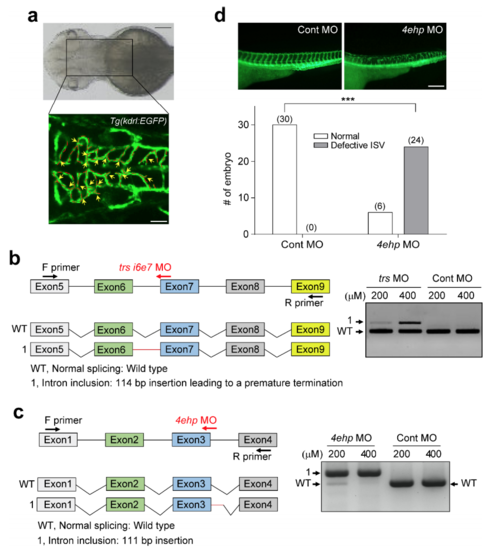
Validation of TRS and 4EHP suppression in zebrafish. a Formation of stereotypical central arteries (CtAs) in the developing hindbrain of zebrafish embryos. (upper) Dorsal view bright-field image of the brain of zebrafish embryos captured at 52 h post-fertilization (hpf). The boxed region of the Tg(kdrl:EGFP) embryo is the area imaged using confocal microscopy. Scale bar = 100 m. (lower) Representative z-projected fluorescence image of a Tg(kdrl:EGFP) embryo at 52 hpf. Using this image, the length (red dotted lines) and branching points (yellow arrows) of CtA vessels were measured using ImageJ. Scale bar = 50 m. b Validation of TRS knock-down by RT-PCR using trs i6e7 MO. The location of the morpholino (MO) used to block the splicing of trs transcripts and primers used for RTPCR are indicated in the genomic structure of zebrafish trs. Injection of different amounts of MO (200 and 400 M) resulted in an additional single RT-PCR band due to aberrant splicing (band 1). Sequencing of the aberrant PCR band 1 revealed the 114 bp intron inclusion that leads to premature translational termination upon trs i6e7 MO injection. Cont MO, control MO. c Validation of zebrafish 4ehp knock-down by RTPCR. The locations of the MO used to block 4ehp splicing and primers used for RTPCR are indicated in the genomic structure of zebrafish 4ehp. Injection of different amounts of the MO shifted the RT-PCR band due to aberrant splicing (band 1). Sequencing of the aberrant PCR band 1 revealed the 111 bp intron inclusion. d Trunk vessel defects upon 4ehp knock-down. (upper) Trunk vessels of control- (left) and 4ehp MO-treated zebrafish (right) shown in lateral views. (lower) Angiogenic defects of intersegmental vessels (ISVs) in the developing trunk are more prevalent in 4ehpsuppressed fish than in controls (Cont) at 52 hpf. Scale bar = 200 m. Quantified data are shown in a bar graph. Numbers of analyzed zebrafish embryos are shown in bars. ***, p <0.001 vs. control group. Values are means SD.
|
| Fish: | |
|---|---|
| Knockdown Reagent: | |
| Observed In: | |
| Stage: | Long-pec |