
Fig. 1
- ID
- ZDB-FIG-190723-780
- Publication
- Wang et al., 2019 - Gene profiling of head mesoderm in early zebrafish development: insights into the evolution of cranial mesoderm
- Other Figures
- All Figure Page
- Back to All Figure Page
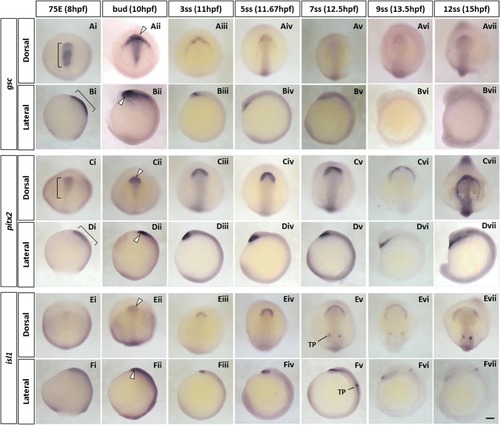
Spatio-temporal expression of prechordal plate marker genes (gsc, pitx2 and isl1) during zebrafish early development. A–F Whole-mount in situ hybridisation of zebrafish prechordal plate/polster marker genes. Embryos were hybridised with gsc (Ai–vii, Bi–vii), pitx2 (Ci–vii, Di–vii) and isl1 probes (Ei–vii, Fi–vii). Expression of all three marker genes is detected in the pre-polster, a distinct group of cells located underneath the forebrain, at 75% epiboly stage (Ai, Ci, Ei). gsc and pitx2 transcripts are also detected in the posterior prechordal plate during early development (Ai–ii, Bi–ii, Ci–ii, Di–ii). From 7-somite stage onwards, expression of isl1 was also seen in the trigeminal placodes (Ev-vii, Fv-vii). White arrowheads indicate the expression of marker genes in the polster, the most anterior part of the prechordal plate. Brackets indicate strong expression of gsc (Ai, Bi) and graded expression of pitx2 from the anterior to the posterior tip in the prechordal plate during late gastrula period (Ci, Di). In all images, anterior is oriented to the top. Lateral images (B, D, F) are viewed from the left side of the embryos. 75E, 75% epiboly; hpf, hours post-fertilisation; ss, somite stage; TP, trigeminal placode. Scale bar: 100 μm
|
| Genes: | |
|---|---|
| Fish: | |
| Anatomical Terms: | |
| Stage Range: | 75%-epiboly to 10-13 somites |