
Fig.2
- ID
- ZDB-FIG-190723-781
- Publication
- Wang et al., 2019 - Gene profiling of head mesoderm in early zebrafish development: insights into the evolution of cranial mesoderm
- Other Figures
- All Figure Page
- Back to All Figure Page
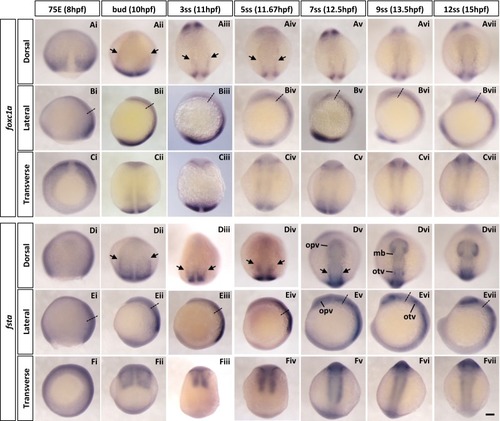
Spatio-temporal expression of cranial paraxial mesoderm marker genes (foxc1a and fsta) during zebrafish early development. A–F Whole-mount in situ hybridisation of zebrafish cranial paraxial mesoderm marker genes. The embryos were stained with foxc1a (Ai–vii, Bi–vii, Ci–vii) and fsta (Di–vii, Ei–vii, Fi–vii) probes. Both genes were expressed in the paraxial mesoderm, including the cranial paraxial mesoderm and the presomitic mesoderm. Black arrows indicate the cranial paraxial mesoderm. Anterior is to the top in dorsal and lateral views; in all transverse views, dorsal side is oriented to the top. Transverse views were taken at the level indicated by the dashed lines in lateral views. 75E, 75% epiboly; hpf, hours post-fertilisation; mb, midbrain; opv, optic vesicle; otv, otic vesicle; ss, somite stage. Scale bar: 100 μm
|
| Genes: | |
|---|---|
| Fish: | |
| Anatomical Terms: | |
| Stage Range: | 75%-epiboly to 10-13 somites |