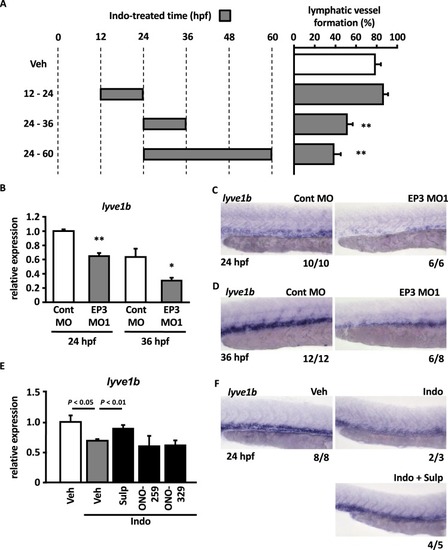
Role of the PGE2-EP3 pathway in the lymphatic specification from venous to lymphatic endothelial cells. (A) Tg(fli1a:egfp) embryos were treated with Veh or Indo (100 μM) for the indicated times. The ratio of PL-positive segments at 60 hpf was quantified. Each value represents the mean ± SEM (N = 5). **P < 0.01 vs Veh. (B) Relative expression levels of lyve1b were quantified by RT-qPCR in morphants at 24 and 36 hpf. Values are shown relative to the value obtained with Cont MO at 24 hpf. Each value represents the mean ± SEM (N = 3–4) *P < 0.05, **P < 0.01 vs Cont MO at each corresponding time. (C,D) Expression of lyve1b was analyzed by WISH in morphants at 24 hpf (C) and 36 hpf (D). (E,F) Zebrafish embryos were treated with Veh or Indo (100 μM) in the absence or presence of EP agonists (10 μM) from 0 to 24 hpf. The expression level of lyve1b was quantified by RT-qPCR (E). The values are shown relative to the value obtained with Veh. Each value represents the mean ± SEM (N = 3–4). Expression of lyve1b was analyzed by WISH at 24 hpf (F). The number at the bottom right of each panel indicates the number of embryos demonstrating the phenotype shown in the panel over the total number of embryos analyzed in a representative experiment.
|
