
FIGURE
FIGURE 2
- ID
- ZDB-FIG-190723-2030
- Publication
- de Pater et al., 2018 - Bloody Zebrafish: Novel Methods in Normal and Malignant Hematopoiesis
- Other Figures
- All Figure Page
- Back to All Figure Page
FIGURE 2
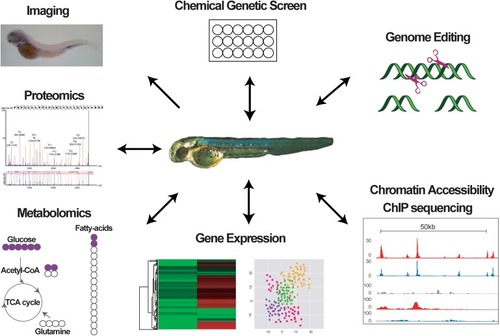
Graph indicating different methods used to study zebrafish hematopoiesis. |
Expression Data
Expression Detail
Antibody Labeling
Phenotype Data
Phenotype Detail
Acknowledgments
This image is the copyrighted work of the attributed author or publisher, and
ZFIN has permission only to display this image to its users.
Additional permissions should be obtained from the applicable author or publisher of the image.
Full text @ Front Cell Dev Biol