|
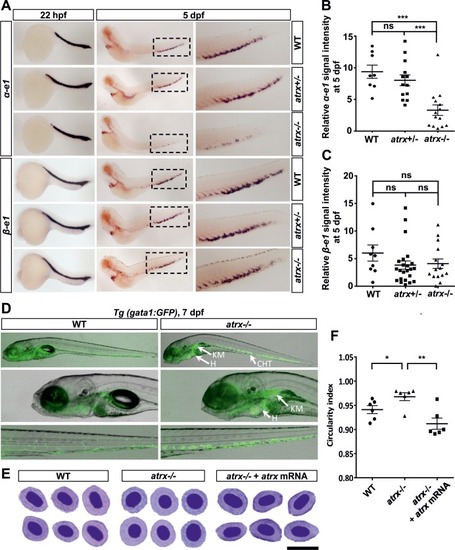
Homozygous loss of <italic>atrx</italic> results in an α-thalassemia-like phenotype in zebrafish development.(A) Whole-mount in situ hybridization for α-e1 and β-e1 globins in wildtype (WT), atrx+/- heterozygous fish and atrx-/- homozygous mutants at 22 hpf and 5 dpf as indicated. Boxes outline the CHT region at 5 dpf, and are magnified in the right panels. Globin signal intensities of α-e1(B) and β-e1(C) in fish with different atrx backgrounds were calculated at 5dpf. Horizontal bars indicate the means ± SEM, which were compared with the two-tailed unpaired t-test; ns = not significant; ***p<0.001. (D) Erythroid progenitors development visualized by GFP in the Tg(gata1:GFP) transgenic line with wildtype (WT) or atrx-/- background at 7 dpf. CHT = caudal hematopoietic tissue; H = heart; KM = kidney marrow; dpf = days post fertilization. (E) Analysis of peripheral blood smears by MGG staining in wildtype fish (WT), atrx-/- homozygous mutant and atrx-/- homozygous mutant injected with zebrafish atrx mRNA at 7 dpf; scale bar: 10 μm. (F) Circularity index for the erythroid cells from fish with different atrx backgrounds (E) was calculated by ImageJ. Horizontal bars indicate the means ± SEM, which were compared with the two-tailed unpaired t-test; *p<0.05; **p<0.01.
|