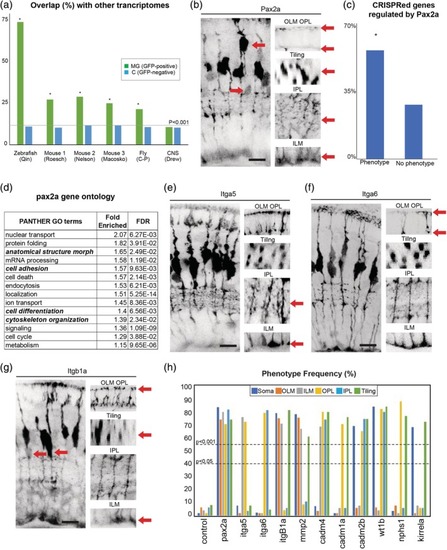
A set of highly conserved genes that affect MG cell morphology. (a) Overlap of zebrafish MG enriched genes with previously reported MG transcriptomes from zebrafish, mouse, and fly (Macosko et al., 2015; Nelson et al., 2011; Qin, Barthel, & Raymond, 2009; Roesch et al., 2008; Sifuentes, Kim, Swaroop, & Raymond, 2016). MG—genes enriched in GFAP‐positive cells; C—Genes enriched in non‐GFP positive cells; * indicates significance (Bonferroni adjusted p‐value <0.001) by Fisher's exact test. (b) pax2a CRISPR injected animals have highly disorganized retinas with breaks in the OLM and ILM, abnormal tiling and apico‐basal distribution of the cell bodies, as well as much less branching in the IPL and OPL (see Supporting Information Table S4 for details). (c) Percentages of genes used in this study that either had or did not have a phenotype. * indicates significance by Fisher's exact test. (d) GO terms for the top 500 genes significantly (adjusted p < 0.05) up or down‐regulated pax2a mutants. (e) itga5 CRISPR injected animals have defects on the basal side of MG specifically in the ILM and IPL. (f) Itag6 CRISPR injected animals have defects on the apical side of the cell in the OLM and OPL. (g) F0 itb1a CRISPR injected animals have defects in cell body tiling and apico‐basal position, as well as in OLM and ILM. (h) Frequency (%) of phenotypes observed in each MG compartment in F0 CRISPR screen 3. Scale bars = 8μm
|
