FIGURE

Figure 3

ID
ZDB-FIG-190723-1192
Publication
Charlton-Perkins et al., 2019 - Genetic control of cellular morphogenesis in Müller glia
Other Figures
All Figure Page
Back to All Figure Page
Figure 3

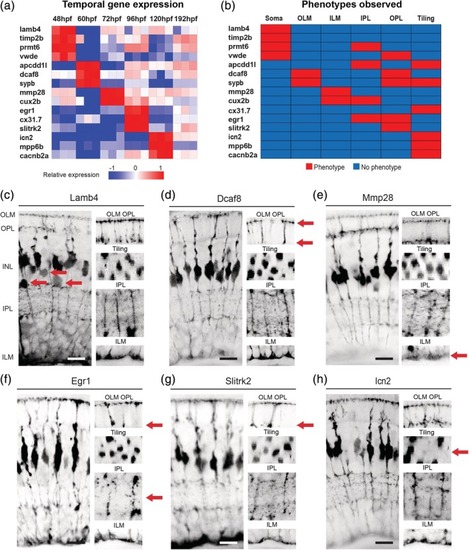
Discrete gene expression regulates MG cell compartment morphology. (a) Heatmap to show the relative gene expression for genes tested. These were all screen in F0 CRISPR injected mutants. (b) Summary of phenotypes observed for genes enriched across windows of MG differentiation. Red—phenotype, blue—no‐phenotype. (c) lamb4 mutants have defects in the apico‐basal distribution of MG cell bodies only. (d) dcaf8 mutants have defects in the OLM and OPL. (e) mmp28 CRISPR injected mutants have defects in the ILM only. (f) egr1 mutants have defects in the IPL and OPL. (g) slitkr2 mutants have defects in the OPL layer only. (h) icn2 mutants have tiling defects only. 1. Frequency (%) of phenotypes observed in each MG compartment in F0 CRISPR screen 2. Scale bars = 8 μm

Expression Data

Expression Detail
Antibody Labeling
Phenotype Data
Fish:
Knockdown Reagents:
Observed In:
Stage: Day 5

Phenotype Detail
Acknowledgments
This image is the copyrighted work of the attributed author or publisher, and ZFIN has permission only to display this image to its users. Additional permissions should be obtained from the applicable author or publisher of the image. Full text @ Glia