
Fig. S1
- ID
- ZDB-FIG-190717-12
- Publication
- Wang et al., 2019 - Selective processing of all rotational and translational optic flow directions in the zebrafish pretectum and tectum
- Other Figures
- All Figure Page
- Back to All Figure Page
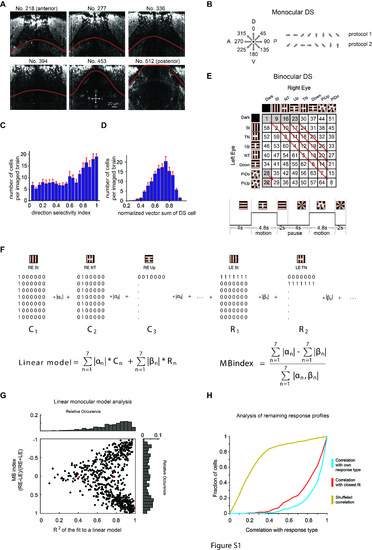
Experimental parameters and auxiliary analyses. (A) Defining the tectal-pretectal boundary. Each image is a transverse view and the number indicates the pixel position (1 pixel = 0.43 μm in the anterior-posterior direction). D, dorsal; V, ventral; R, right; L, left. (B) Monocular stimulus protocols to map preferred directions. Left: motion directions; Right: Temporal sequence (rightwards) of the two stimulus protocols used in different recordings. A, anterior; P, posterior. (C) Histogram of direction selectivity from all recorded motion-sensitive cells. (D) Histogram of the normalized vector sum of DS neurons (n = 9 brains, pretectum and tectum combined in (C) and (D)). (E) Stimulus protocol for the binocular direction selectivity experiment. Top: 8 × 8 unique stimulation phases were presented in the indicated order and repeated three times in the protocol. Bottom: Schematic of two individual stimulus periods. (F) Linear model equation used to assess functional properties of binocular optic flow processing (see “Materials and methods”). (G) Linear model analysis. Monocular neurons (with high absolute MB index) tended to be fit very well by the linear sum model, while more binocularly driven neurons (MB index close to 0) were not fit well. This suggests that binocularly driven neurons are often suppressed during particular stimulus phases, but not for other stimulus phases in the same row or column, thus establishing binocular response selectivity. (H) Analysis of the similarity of infrequent responses to the more frequent response types found in Fig. 2e. The red and blue lines show the cumulative distributions of the correlations of neurons from the infrequent group with the best matching frequent response type and correlations of neurons from the frequent group with their response type, respectively. The yellow line shows the correlation of the neuronal responses with a randomly selected, existing response type (shuffled). (JPG 10220 kb) |