
- Title
-
Selective processing of all rotational and translational optic flow directions in the zebrafish pretectum and tectum
- Authors
- Wang, K., Hinz, J., Haikala, V., Reiff, D.F., Arrenberg, A.B.
- Source
- Full text @ BMC Biol.
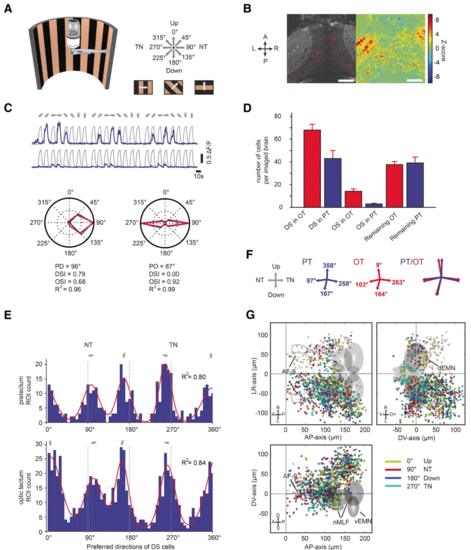
Monocular motion stimuli reveal four orthogonal preferred directions in the zebrafish pretectum and optic tectum. aA half-cylindrical stimulus arena was used to present motion in eight different directions to the zebrafish (not drawn to scale). b Time-averaged optical slice of tectal GCaMP5G expression (left). The z-score heat map (right) was used to detect motion-sensitive pixels and circular regions of interest (ROIs) were drawn manually (left). Scale bar, 50 μm (c) Top: ΔF/F responses (of three stimulus repetitions) of two example neurons. Grey lines indicate the motion phases; their shape corresponds to the signal expected for a motion-sensitive cell (regressor, see “Materials and methods”). Bottom: Polar plots illustrating responses for each stimulus phase for one direction-selective (left) and one orientation-selective (right) cell. Blue lines correspond to the median ΔF/F from three repetitions, red lines to the fitted von-Mises function used to infer the preferred direction (PD), the direction and orientation selectivity indices (DSI and OSI), and the goodness of fit (R2). d Number of identified DS and OS cells per recorded brain in optic tectum (OT) and pretectum (PT). Motion-sensitive cells that are neither DS nor OS are classified as “Remaining.” e Histograms of the preferred directions of direction-selective neurons in pretectum (top) and optic tectum (bottom) (pooled from nine imaged brains). The four peaks were fitted with a sum of four von-Mises functions (red line). f The four fitted peak directions from e are plotted for pretectum (blue) and optic tectum (red). Please note that in panels e and f the illustration arrow for NT points in a different direction than in panels a and c. We chose to switch arrangement to allow an easier comparison of panel (e) to the plots published in a previous report (Fig. 2a of Hunter et al [14]). gAnatomical maps of DS neurons (color-coded according to PD) in the tectum and pretectum. AF-9, arborization field 9-containing neuropil; nMLF, nucleus of the medial longitudinal fasciculus; vEMN/dEMN, ventral and dorsal extraocular motoneurons. Error bars correspond to SEM. A, anterior; P, posterior; L, left; R, right; D, dorsal; V, ventral |
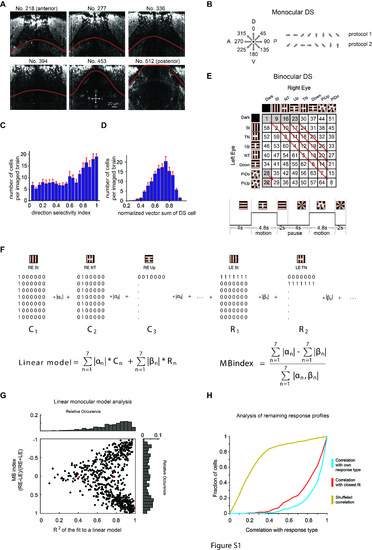
Experimental parameters and auxiliary analyses. (A) Defining the tectal-pretectal boundary. Each image is a transverse view and the number indicates the pixel position (1 pixel = 0.43 μm in the anterior-posterior direction). D, dorsal; V, ventral; R, right; L, left. (B) Monocular stimulus protocols to map preferred directions. Left: motion directions; Right: Temporal sequence (rightwards) of the two stimulus protocols used in different recordings. A, anterior; P, posterior. (C) Histogram of direction selectivity from all recorded motion-sensitive cells. (D) Histogram of the normalized vector sum of DS neurons (n = 9 brains, pretectum and tectum combined in (C) and (D)). (E) Stimulus protocol for the binocular direction selectivity experiment. Top: 8 × 8 unique stimulation phases were presented in the indicated order and repeated three times in the protocol. Bottom: Schematic of two individual stimulus periods. (F) Linear model equation used to assess functional properties of binocular optic flow processing (see “Materials and methods”). (G) Linear model analysis. Monocular neurons (with high absolute MB index) tended to be fit very well by the linear sum model, while more binocularly driven neurons (MB index close to 0) were not fit well. This suggests that binocularly driven neurons are often suppressed during particular stimulus phases, but not for other stimulus phases in the same row or column, thus establishing binocular response selectivity. (H) Analysis of the similarity of infrequent responses to the more frequent response types found in Fig. 2e. The red and blue lines show the cumulative distributions of the correlations of neurons from the infrequent group with the best matching frequent response type and correlations of neurons from the frequent group with their response type, respectively. The yellow line shows the correlation of the neuronal responses with a randomly selected, existing response type (shuffled). (JPG 10220 kb) |
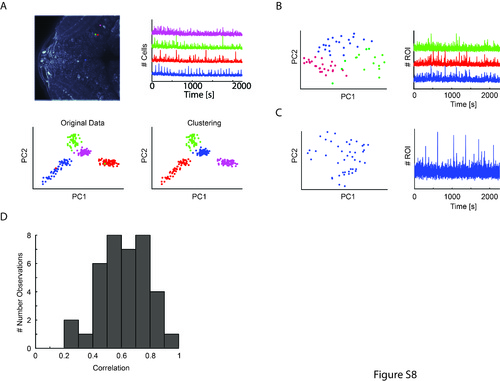
Clustering of local pixel correlations reveals highly correlated activity patterns for cells that were classified as multiple ROIs. (A) Examples demonstrating the effectiveness of the method. Four ROIs that were manually identified to be single cells (their activity traces are shown on the right) were combined and each pixel of these ROIs was correlated with each other. Subsequently, we performed principal component analysis (PCA) and expectation maximization clustering, which automatically segmented even spatially close neurons as independent units. Pixels were plotted according to the first two principal components (PCs) at the bottom, illustrating that that the developed algorithm (PCA and clustering) successfully identified the correspondence of the pixels to their original ROIs (lower left: color code based on manual ROI selection, lower right: color code based on assigned cluster identity). (B) Example cluster analysis showing a potential “multiple-cell” ROI (see manual analysis in Additional file 7: Figure S7) that was split into three separate clusters by the algorithm (left); and the accompanying activity traces for each cluster (shown on the right). (C) Example cluster analysis showing an ROI that wasn’t split, and its corresponding activity trace. (D) Quantification of the average correlation of the mean ROI traces resulting from the clustering (e.g., average correlation of the three traces shown in (B)). Correlation is overall high, suggesting that there is no major signal contamination even for neurons that were manually assigned to potentially contain multiple-cell activity. (JPG 2823 kb) |