
Fig. 1
- ID
- ZDB-FIG-190717-11
- Publication
- Wang et al., 2019 - Selective processing of all rotational and translational optic flow directions in the zebrafish pretectum and tectum
- Other Figures
- All Figure Page
- Back to All Figure Page
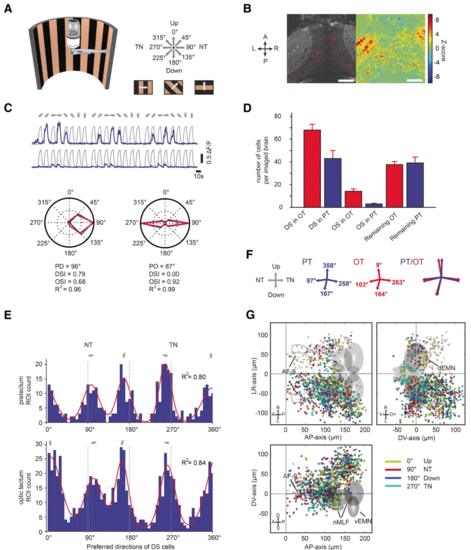
Monocular motion stimuli reveal four orthogonal preferred directions in the zebrafish pretectum and optic tectum. aA half-cylindrical stimulus arena was used to present motion in eight different directions to the zebrafish (not drawn to scale). b Time-averaged optical slice of tectal GCaMP5G expression (left). The z-score heat map (right) was used to detect motion-sensitive pixels and circular regions of interest (ROIs) were drawn manually (left). Scale bar, 50 μm (c) Top: ΔF/F responses (of three stimulus repetitions) of two example neurons. Grey lines indicate the motion phases; their shape corresponds to the signal expected for a motion-sensitive cell (regressor, see “Materials and methods”). Bottom: Polar plots illustrating responses for each stimulus phase for one direction-selective (left) and one orientation-selective (right) cell. Blue lines correspond to the median ΔF/F from three repetitions, red lines to the fitted von-Mises function used to infer the preferred direction (PD), the direction and orientation selectivity indices (DSI and OSI), and the goodness of fit (R2). d Number of identified DS and OS cells per recorded brain in optic tectum (OT) and pretectum (PT). Motion-sensitive cells that are neither DS nor OS are classified as “Remaining.” e Histograms of the preferred directions of direction-selective neurons in pretectum (top) and optic tectum (bottom) (pooled from nine imaged brains). The four peaks were fitted with a sum of four von-Mises functions (red line). f The four fitted peak directions from e are plotted for pretectum (blue) and optic tectum (red). Please note that in panels e and f the illustration arrow for NT points in a different direction than in panels a and c. We chose to switch arrangement to allow an easier comparison of panel (e) to the plots published in a previous report (Fig. 2a of Hunter et al [14]). gAnatomical maps of DS neurons (color-coded according to PD) in the tectum and pretectum. AF-9, arborization field 9-containing neuropil; nMLF, nucleus of the medial longitudinal fasciculus; vEMN/dEMN, ventral and dorsal extraocular motoneurons. Error bars correspond to SEM. A, anterior; P, posterior; L, left; R, right; D, dorsal; V, ventral |