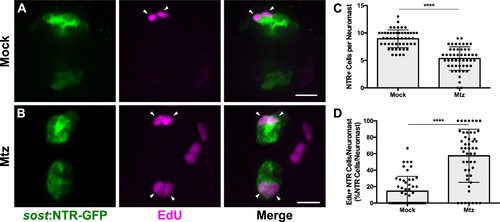
(A–B) Maximum projections of neuromasts from sost:NTR-GFP fish either untreated (A; Mock) or treated with 10 mM Mtz (B; Mtz). Sost:NTR-GFP cells are shown in green and EdU-positive cells are shown in magenta. Arrowheads indicate EdU-positive sost:NTR-GFP cells. Scale bar = 10 μm. (C) Total number of sost:NTR-GFP cells per neuromast following DV cell regeneration. Mock: 8.94 ± 1.62, n = 50 neuromasts (10 fish); Mtz: 5.34 ± 2.14, n = 50 neuromasts (10 fish); mean ± SD; Mann Whitney U test, p<0.0001. (D) Percentage of sost:NTR-GFP cells per neuromast labeled by EdU following DV cell regeneration. Mock: 14.47 ± 17.95, n = 50 neuromasts (10 fish); Mtz: 57.49 ± 32.34, n = 50 neuromasts (10 fish); mean ± SD; Mann Whitney U test, p<0.0001.