
FIGURE
Fig. 2-S1
Fig. 2-S1
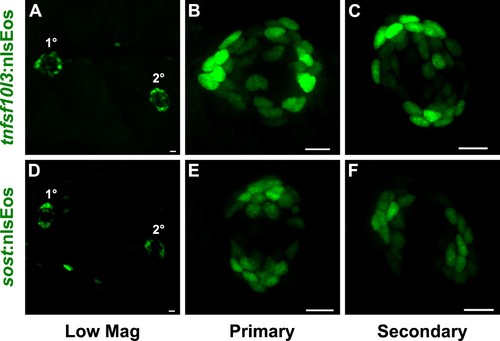
Asymmetry of support cell transgene expression in secondary neuromasts is orthogonal to primary neuromasts.(A–F) Maximum projections of lateral views of trunks (taken at 20x zoom) (A,D) or of individual neuromasts (B–C, E–F) from tnfsf10l3:nlsEos (A–C), and sost:nlsEos fish (D–F). Unconverted nlsEos-positive cells are shown in green. In Low Mag images (A,D), primary neuromasts are labeled with 1°, and secondary neuromasts are labeled with 2°. Scale bar = 10 μm. |
Expression Data
Expression Detail
Antibody Labeling
Phenotype Data
Phenotype Detail
Acknowledgments
This image is the copyrighted work of the attributed author or publisher, and
ZFIN has permission only to display this image to its users.
Additional permissions should be obtained from the applicable author or publisher of the image.
Full text @ Elife