
Fig. 8
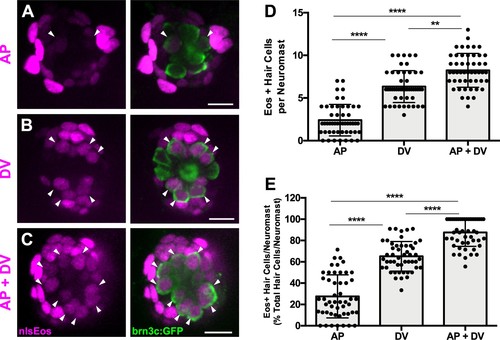
AP cells and DV cells define separate progenitor populations.(A–C) Maximum projections of neuromasts from tnfsf10l3:nlsEos (AP, (A), sost:nlsEos (DV, (B), and tnfsf10l3:nlsEos/sost:nlsEos fish (AP + DV, (C) following photoconversion and regeneration. Converted nlsEos-positive cells are shown in magenta, and brn3c:GFP-positive hair cells are shown in green. Arrowheads indicate nlsEos-positive hair cells. Scale bar = 10 μm. (D) Number of nlsEos-positive hair cells per neuromast in each of the nlsEos lines following regeneration. Tnfsf10l3:nlsEos (AP): 2.4 ± 1.84, n = 50 neuromasts (10 fish); sost:nlsEos (DV): 6.34 ± 1.87, n = 50 neuromasts (10 fish); tnfsf10l3:nlsEos/sost:nlsEos (AP + DV): 8.24 ± 1.99, n = 50 neuromasts (10 fish); mean ±SD; Kruskal-Wallis test, Dunn’s post-test, p<0.0001 (AP vs. DV, AP vs. AP + DV), p=0.0031 (DV vs. AP + DV). (E) Percentage of hair cells per neuromast labeled by nlsEos lines following regeneration. AP: 27.59 ± 20.21, n = 50 neuromasts (10 fish); DV: 65.16 ± 13.89, n = 50 neuromasts (10 fish); AP + DV: 87.57 ± 13.02, n = 50 neuromasts (10 fish); mean ± SD; Kruskal-Wallis test, Dunn’s post-test, p<0.0001 (all comparisons). |
| Gene: | |
|---|---|
| Fish: | |
| Condition: | |
| Anatomical Term: | |
| Stage: | Days 7-13 |