
Fig. 1
- ID
- ZDB-FIG-190530-9
- Publication
- Subramanian et al., 2018 - Mechanical force regulates tendon extracellular matrix organization and tenocyte morphogenesis through TGFbeta signaling
- Other Figures
- All Figure Page
- Back to All Figure Page
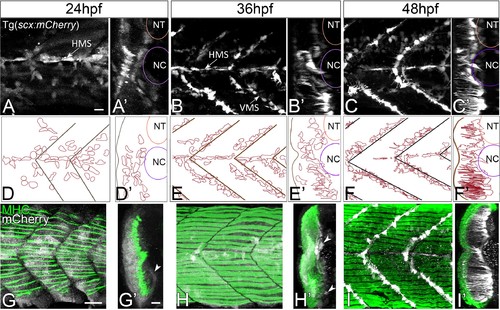
Axial tenocyte morphogenesis.(A–C) Lateral views of live Tg(scx:mCherry) embryos showing developing tenocytes (A - 24 hpf, B - 36 hpf, C - 48 hpf). (A’–C’) Transverse views from 3D projections showing the positions of developing tenocytes in relation to the notochord (NC) and neural tube (NT) along the horizontal (HMS) and vertical myosepta (VMS) (arrows). Tenocytes form projections at 36–48 hpf (B’ and C’). (D–F) Diagrams of lateral views showing the morphology of tenocytes in the developing somites. (D’–F’) Diagrams of transverse views from 3D projections of live Tg(scx:mCherry) embryos show the development of tenocyte projections (E’ and F’). (G–I) Lateral views of co-immunostained Tg(scx:mCherry) embryos showing developing tenocytes (anti-mCherry - white) and muscle fibers (anti-MHC - green) (G – 24 hpf, H – 36 hpf, I – 48 hpf). (G’–I’) Transverse views from 3D projections of live Tg(scx:mCherry) embryos showing the positions of developing tenocytes (arrowheads in G’ and H’) in relation to the myotome. Scale bars = 20 microns. |
| Gene: | |
|---|---|
| Antibody: | |
| Fish: | |
| Anatomical Terms: | |
| Stage Range: | Prim-5 to Long-pec |