
Fig. 2
- ID
- ZDB-FIG-190530-10
- Publication
- Subramanian et al., 2018 - Mechanical force regulates tendon extracellular matrix organization and tenocyte morphogenesis through TGFbeta signaling
- Other Figures
- All Figure Page
- Back to All Figure Page
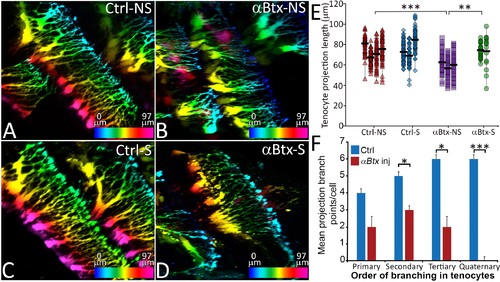
Tenocyte projection length and branching density is regulated by mechanical force.Lateral views of live Tg(scx:mCherry) embryos (48 hpf) showing tenocyte projections. Images are pseudocolored by depth from medial (red) to lateral (blue). Control embryos were imaged without stimulation (A) and after stimulation (B), and the length of tenocyte projections was compared with embryos injected with αBtx and imaged without (C) and with stimulation (D). Dot plot shows individual data points of tenocyte projection length under different conditions (E). The data points from each embryo are connected by a vertical line. NS – Not Stimulated, S – Stimulated. (n > 50 data points/embryo in three embryos/sample, p value was determined through ANOVA 1-way analysis ***<0.00001, **<0.0001). Histogram shows quantification of branch points along tenocyte projections per tenocyte in 36 hpf control and αBtx injected embryos for every level of branching (1o – primary, 2o – secondary, 3o – tertiary, 4o – quaternary). (n = 4, p value was determined through ttest *<0.01, ***<0.00001). The measurements used for quantitative analysis and creation of the plots can be accessed from Figure 2—source data 1 and Figure 2—source data 2. |