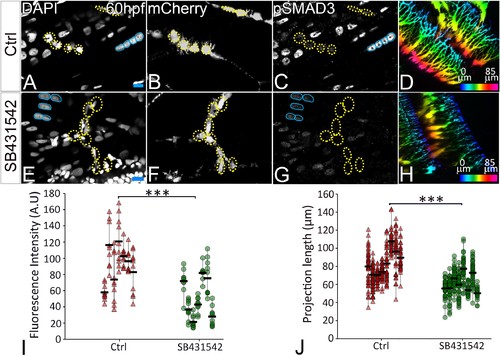
Lateral views of immunostained Tg(scx:mCherry) control (A–D) and SB431542-treated (E–H) embryos showing nuclei (DAPI), tenocytes (anti-mCherry) and pSMAD3 (anti-pSMAD3). (I) Localization of pSMAD3 was quantified as fluorescent intensity of nuclear pSMAD3 signal (marked by yellow dotted ROI) and plotted as a dot plot showing data points (n = 9, p value was calculated by t test ***<0.000005). (D, H) Pseudocolored 3D projections show tenocyte cell projections in control (D) and SB 431542 treated embryos (H). (J) Dot plot shows individual data points representing tenocyte projection lengths (n = 50 data points/embryo in nine embryos/sample, p value was calculated by Wilcoxon Rank Sum test ***<0.00005). Representative muscle nuclei are marked by a blue continuous ROI. Scale bars = 10 microns. The measurements used for quantitative analysis and creation of the plots can be accessed from Figure 5—source data 1 and Figure 5—source data 2.