
Fig. 7
- ID
- ZDB-FIG-190530-24
- Publication
- Olstad et al., 2018 - Ciliary Beating Compartmentalizes Cerebrospinal Fluid Flow in the Brain and Regulates Ventricular Development
- Other Figures
- All Figure Page
- Back to All Figure Page
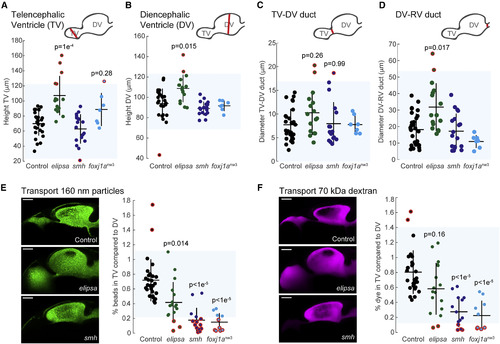
The BrainVentricular System Is Differentially Affected upon Loss of Primary versus Motile Cilia (A–D) Increased incidence of hydrocephalus is observed in the cilia mutant elipsa, but not in smh and foxj1anw3. Various ventricular hallmarks were measured in larvae injected with 70-kDa RITC-dextran at 4 dpf. These included the height of the telencephalic (TV; A) and the diencephalic (DV; B) ventricles and the width of the TV-DV duct (C) and the DV-RV duct (D). The controls for all mutants are pooled into one group and compared to mutants lacking all cilia, elipsa (green), or motile cilia mutants, smh and foxj1anw3 (blue). Outliers (encircled in red) were defined as measurements outside the 1.5 interquartile ranges of the pooled control group (light blue box). The p value above the respective mutant line reports its significant difference compared to the pooled control group. Elipsa mutant larvae demonstrated increased numbers of outliers and differed significantly from controls for the measurements of the TV (A), DV (B), and DV-RV duct (D), but not for the TV-DV duct (C). smh and foxj1anw3 mutant larvae show no significant difference compared to controls (A–D; nctrl = 29, nelipsa = 16, nsmh = 18, and nfoxj1anw3 = 7). (E and F) Motile cilia mutants (smh and foxj1anw3) were more susceptible to obstructed ventricular ducts than the primary cilia mutant elipsa at 4 dpf. This was measured as the relative diffusion of large 160-nm-diameter particles (E) or of 70-kDa RITC-dextran (F) from the diencephalon to the telencephalon upon injection into the rhombencephalic ventricle. All controls were pooled for comparison to the cilia mutants. Horizontal lines indicate the mean of the respective sample groups. Vertical lines represent the mean ± SD. The blue box identifies the lower and upper threshold of the pooled control group used to determine outliers (encircled in red). All p values were calculated with a Kruskal-Wallis test followed by pairwise comparison (nctrl = 28, nelipsa = 17, nsmh = 14, and nfoxj1anw3 = 10). Scale bars are 50 μm. See also Figure S6. |
| Fish: | |
|---|---|
| Observed In: | |
| Stage: | Day 4 |