
FIGURE
Fig. 1
- ID
- ZDB-FIG-190530-21
- Publication
- Olstad et al., 2018 - Ciliary Beating Compartmentalizes Cerebrospinal Fluid Flow in the Brain and Regulates Ventricular Development
- Other Figures
- All Figure Page
- Back to All Figure Page
Fig. 1
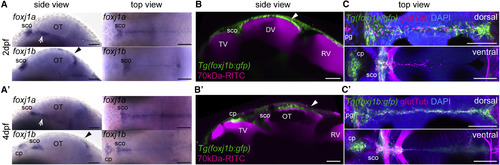
(A and A’) foxj1a and foxj1b genes, which are the two master regulators of motile ciliogenesis, are expressed in different populations of cells in the developing brain as shown by in situ hybridization in 2 (A) and 4 dpf (A’) zebrafish larvae. The foxj1a-expressing cells are situated along the ventral midline (white arrow) of the optic tectum (OT), while foxj1b expression is observed rostrocaudally along the dorsal midline (black arrowhead) of the diencephalon at 2 (A) and 4 dpf (A’). Both foxj1a and foxj1b are expressed in the subcommissural organ (sco), although only foxj1b is expressed in the choroid plexus (cp) at 4 dpf (A’; nfoxj1a, 2 dpf = 28; nfoxj1b, 2 dpf = 13; nfoxj1a, 4 dpf = 13; and nfoxj1b, 4 dpf = 8). (B and B’) T2BGSZ10 Tg(foxj1b:gfp) transgenic larvae show GFP-labeled ciliated cells on the dorsal wall of the diencephalic ventricle (white arrowhead). GFP-positive cells are in direct contact with the brain ventricles labeled by ventricular injection of 70-kDa Rhodamine B isothiocyanate (RITC)-dextran (magenta). Confocal microscopy image of the sagittal midline of anesthetized larvae at 2 (B) and 4 dpf (B’) is shown. The zebrafish ventricular system is composed of three cavities: the telencephalic ventricle (TV); the mesencephalic/diencephalic ventricle (DV); and the rhombencephalic ventricle (RV), which are connected by ducts. Although the compartmentalization of the ventricular system persists from 2 to 4 dpf, the size of the cavities decreases over development (n2 dpf = 7 and n4 dpf = 11). (C and C’) GFP-positive cells extend their cilia into the ventricular cavity in both dorsal and ventral regions of the diencephalon, as shown by immunostaining with a glutamylated tubulin antibody (magenta) and confocal microscopy. Nuclei are labeled with DAPI (blue; n2 dpf = 8 and n4 dpf = 8). Scale bars are 50 μm. cp, choroid plexus; OT, optic tectum; pg, pineal gland; sco, subcommissural organ. See also Figure S1 and Video S1.
|
Expression Data
| Genes: | |
|---|---|
| Fish: | |
| Anatomical Terms: | |
| Stage Range: | Long-pec to Day 4 |
Expression Detail
Antibody Labeling
Phenotype Data
Phenotype Detail
Acknowledgments
This image is the copyrighted work of the attributed author or publisher, and
ZFIN has permission only to display this image to its users.
Additional permissions should be obtained from the applicable author or publisher of the image.
Full text @ Curr. Biol.