
- Title
-
Ciliary Beating Compartmentalizes Cerebrospinal Fluid Flow in the Brain and Regulates Ventricular Development
- Authors
- Olstad, E.W., Ringers, C., Hansen, J.N., Wens, A., Brandt, C., Wachten, D., Yaksi, E., Jurisch-Yaksi, N.
- Source
- Full text @ Curr. Biol.
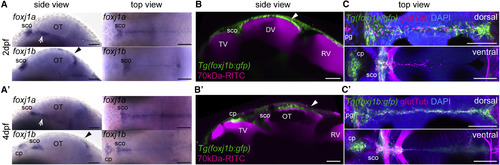
(A and A’) foxj1a and foxj1b genes, which are the two master regulators of motile ciliogenesis, are expressed in different populations of cells in the developing brain as shown by in situ hybridization in 2 (A) and 4 dpf (A’) zebrafish larvae. The foxj1a-expressing cells are situated along the ventral midline (white arrow) of the optic tectum (OT), while foxj1b expression is observed rostrocaudally along the dorsal midline (black arrowhead) of the diencephalon at 2 (A) and 4 dpf (A’). Both foxj1a and foxj1b are expressed in the subcommissural organ (sco), although only foxj1b is expressed in the choroid plexus (cp) at 4 dpf (A’; nfoxj1a, 2 dpf = 28; nfoxj1b, 2 dpf = 13; nfoxj1a, 4 dpf = 13; and nfoxj1b, 4 dpf = 8). (B and B’) T2BGSZ10 Tg(foxj1b:gfp) transgenic larvae show GFP-labeled ciliated cells on the dorsal wall of the diencephalic ventricle (white arrowhead). GFP-positive cells are in direct contact with the brain ventricles labeled by ventricular injection of 70-kDa Rhodamine B isothiocyanate (RITC)-dextran (magenta). Confocal microscopy image of the sagittal midline of anesthetized larvae at 2 (B) and 4 dpf (B’) is shown. The zebrafish ventricular system is composed of three cavities: the telencephalic ventricle (TV); the mesencephalic/diencephalic ventricle (DV); and the rhombencephalic ventricle (RV), which are connected by ducts. Although the compartmentalization of the ventricular system persists from 2 to 4 dpf, the size of the cavities decreases over development (n2 dpf = 7 and n4 dpf = 11). (C and C’) GFP-positive cells extend their cilia into the ventricular cavity in both dorsal and ventral regions of the diencephalon, as shown by immunostaining with a glutamylated tubulin antibody (magenta) and confocal microscopy. Nuclei are labeled with DAPI (blue; n2 dpf = 8 and n4 dpf = 8). Scale bars are 50 μm. cp, choroid plexus; OT, optic tectum; pg, pineal gland; sco, subcommissural organ. See also Figure S1 and Video S1.
|
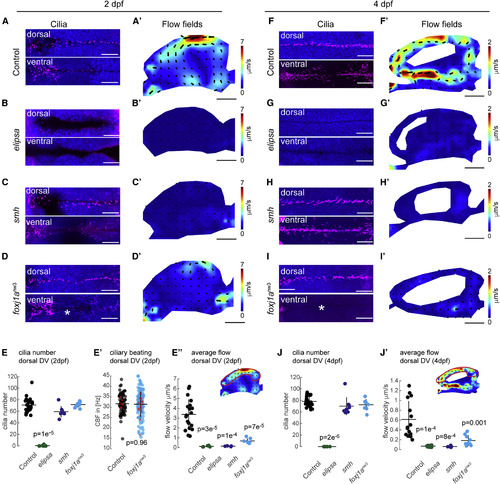
The Directional CSF Flow near the Diencephalic Ventricular Wall Is Generated by Motile Ciliary Beating In order to establish the causal link between ciliary beating and the directional CSF flow near the ventricular walls, we analyzed different mutants with ciliary defects. (A–J) For each mutant line, cilia were labeled by glutamylated tubulin staining (magenta, DAPI in blue) at 2 (A: nctrl, 2 dpf = 21; B: nelipsa, 2 dpf = 8; C: nsmh, 2 dpf = 8; D: nfoxj1anw3, 2 dpf = 8) and 4 dpf (F: nctrl, 4 dpf = 20; G: nelipsa, 4 dpf = 8 ; H: nsmh, 4 dpf = 9; I: nfoxj1anw3, 4 dpf = 8) and counted at 2 (E) and 4 (J) dpf. (A’–J’) The directional CSF flow in the diencephalic ventricle (DV) of each mutant line was measured by confocal imaging of fluorescent beads, analyzed by PIV, compared to controls at 2 (A’: nctrl, 2 dpf = 12, B’: nelipsa, 2 dpf = 6, C’: nsmh, 2 dpf = 8, D’: nfoxj1anw3, 2 dpf = 8) and 4 dpf (F’: nctrl, 4 dpf = 14, G’: nelipsa, 4 dpf = 7, H’: nsmh, 4 dpf = 11, I’: nfoxj1anw3, 4 dpf = 7) and quantified at 2 (E’’) and 4 dpf (J’). (B and G) Elipsa mutants lack all primary and motile cilia, as demonstrated by the absence of glutamylated tubulin staining in a dorsal and ventral section of the diencephalon at 2 dpf (B, quantified in E) and 4 dpf (G, quantified in J). As a result, the directional CSF flow was absent in the diencephalic ventricle of elipsa at 2 (B’, quantified in E’) and 4 dpf (G’, quantified in J’). (C and H) The cilia mutant smh shows no significant difference in the number of cilia at 2 dpf (C, quantified in E) and 4 dpf (H, quantified in J), but the directional CSF flow was abolished (C’, H’, E’’, and J’). (D and I) In the cilia mutant foxj1anw3, the number of cilia along the ventral midline of the DV was reduced (indicated by ∗) at 2 dpf (D) and 4 dpf (I), but not along the dorsal DV (E and J). The difference in cilia number along the ventral DV is more apparent at 4 dpf (I) than at 2 dpf (D). The beating frequency of the cilia in the dorsal DV was not significantly different from controls at 2 dpf when comparing mean of individual larvae (indicated by a red cross); p value was calculated by the Wilcoxon rank-sum test (nctrl = 7, nfoxj1anw3 = 14; E’). The directionality of the CSF flow in foxj1anw3 was similar to controls, yet the velocity was reduced (D’, E’’, I’, and J’). (E and J) Quantification of the cilia number along the dorsal DV at 2 (E) and 4 dpf (J). (E’’ and J’) Quantification of the flow velocity along the dorsal DV at 2 (E’’) and 4 dpf (J’), as indicated in the inset for a control example. All controls from the various mutant clutches are pooled. Horizontal lines indicate the mean of the respective sample groups; vertical lines represent the mean ± SD. All p values were calculated with a Kruskal-Wallis (E and J) or one-way ANOVA (E’’ and J’) test followed by pairwise comparisons. Scale bars are 50 μm (flow fields) or 25 μm (stainings). White areas in flow fields were not included in the PIV analysis, due to the presence of brain tissue and absence of particles. See also Figure S6 and Video S5. |
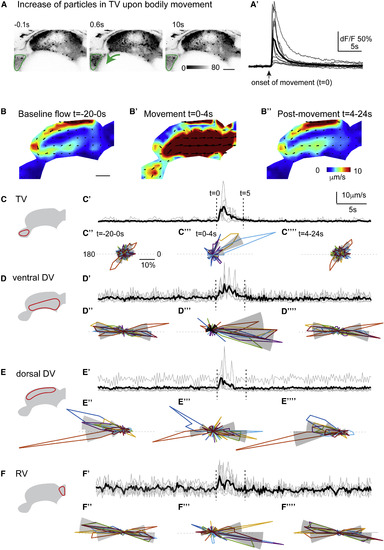
Upon Bodily Movement, the Stringent Compartmentalization of the Larval Ventricular System Is Temporarily Eliminated (A–A’’) Upon bodily movement, the amount of fluorescent particles transiently increases in the telencephalic ventricle (TV), as shown by confocal microscopy of a fluorescent particle-injected larval brain before (−0.1 s), shortly after (0.6 s), or 10 s after bodily movement at 2 dpf (A). The onset of movement corresponds to time 0. The change of fluorescence (dF/F) in the TV (encircled in green in A) upon a single body contraction reveals a fast increase of fluorescence upon bodily motion followed by a slow return to baseline levels (A’). The average (n = 7 movements) is indicated in black. (B–B’’) PIV analysis of fluorescent particle recordings indicates that the CSF flow fields are strongly influenced by movement at 2 dpf. Prior to bodily movement (t = −20–0 s), the directional CSF flow along the ventricular walls is evident, referred to as the baseline flow (B). After the bodily movement (t = 0–4.0 s), a strong surge of CSF backward from the TV to the rhombencephalic ventricle (RV) is prominent (B’). About 4.0 s (t = 4.0–24 s) later, the baseline flow as seen in (B) is re-established (B’’). Representative example of n = 10 is shown. (C–F””) In order to quantify the impact of bodily movement on the CSF flow kinetics, we measured the flow velocity and the flow direction in all consecutive PIV-analyzed frames in the TV (C–C’’’’), the ventral DV (D–D’’’’), the dorsal DV (E–E’’’’), and the RV (F–F’’’’). The velocity of CSF flow increases transiently in the TV, DV, and RV following bodily movement, indicated by a dashed line at time 0, and returns to baseline after 5 s. Black is average of all the movement-induced flow (C’–F’). (C’’–F’’’’) Bodily movements affect the directionality of CSF flow across the ventricles, as indicated by polar histograms of multiple frames preceding movement (−20–0 s; C’’–F’’), shortly after movement (0–4 s; C’’’–F’’’) and following movement (4–24 s; C’’’’–F’’’’). In the TV, the polar histograms show little flow directionality before movement (C’’), a strong directionality of 30° pointing caudally toward the DV shortly after movement (C’’’), and a re-establishment of baseline flow directionality 4 s after the bodily movements (C’’’’). In the ventral DV and RV, the CSF flow is highly pulsatile before and after bodily movement, as indicated by the axial distribution of flow direction pointing toward 180° and 0° (D’’ and F’’). Just after the movement, the flow is primarily oriented caudally toward 0° (D’’’ and F’’’). In the dorsal DV, the flow direction is oriented rostrally with an angle of 180° (C’’ and C’’’’), but after bodily movements, the flow is directed caudally (C’’’). Scale bars are 50 μm. Each individual movement is represented (n = 7 movements). Mean is shown in gray. See also Figure S7 and Video S7. |
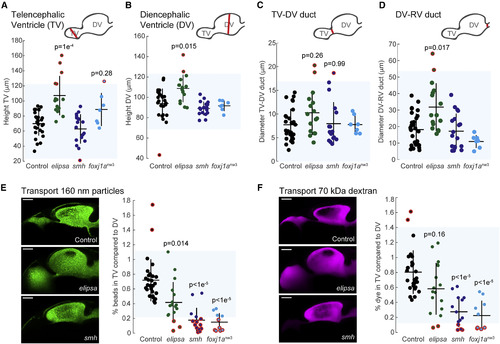
The BrainVentricular System Is Differentially Affected upon Loss of Primary versus Motile Cilia (A–D) Increased incidence of hydrocephalus is observed in the cilia mutant elipsa, but not in smh and foxj1anw3. Various ventricular hallmarks were measured in larvae injected with 70-kDa RITC-dextran at 4 dpf. These included the height of the telencephalic (TV; A) and the diencephalic (DV; B) ventricles and the width of the TV-DV duct (C) and the DV-RV duct (D). The controls for all mutants are pooled into one group and compared to mutants lacking all cilia, elipsa (green), or motile cilia mutants, smh and foxj1anw3 (blue). Outliers (encircled in red) were defined as measurements outside the 1.5 interquartile ranges of the pooled control group (light blue box). The p value above the respective mutant line reports its significant difference compared to the pooled control group. Elipsa mutant larvae demonstrated increased numbers of outliers and differed significantly from controls for the measurements of the TV (A), DV (B), and DV-RV duct (D), but not for the TV-DV duct (C). smh and foxj1anw3 mutant larvae show no significant difference compared to controls (A–D; nctrl = 29, nelipsa = 16, nsmh = 18, and nfoxj1anw3 = 7). (E and F) Motile cilia mutants (smh and foxj1anw3) were more susceptible to obstructed ventricular ducts than the primary cilia mutant elipsa at 4 dpf. This was measured as the relative diffusion of large 160-nm-diameter particles (E) or of 70-kDa RITC-dextran (F) from the diencephalon to the telencephalon upon injection into the rhombencephalic ventricle. All controls were pooled for comparison to the cilia mutants. Horizontal lines indicate the mean of the respective sample groups. Vertical lines represent the mean ± SD. The blue box identifies the lower and upper threshold of the pooled control group used to determine outliers (encircled in red). All p values were calculated with a Kruskal-Wallis test followed by pairwise comparison (nctrl = 28, nelipsa = 17, nsmh = 14, and nfoxj1anw3 = 10). Scale bars are 50 μm. See also Figure S6. PHENOTYPE:
|

ZFIN is incorporating published figure images and captions as part of an ongoing project. Figures from some publications have not yet been curated, or are not available for display because of copyright restrictions. |
|
Unillustrated author statements |