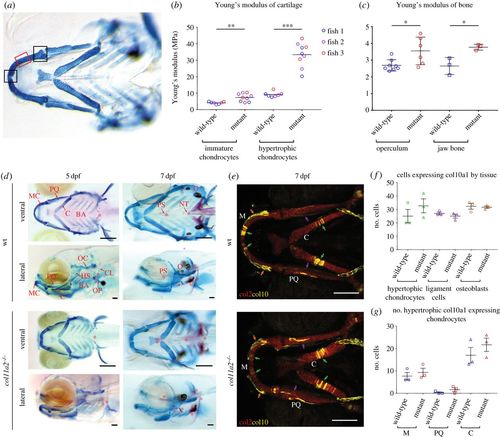
col11a2 mutants have altered material properties in more mature cartilage which is not explained by increased mineralization or hypertrophy. Location of AFM measurements taken from larvae shown in (a). Measurements for immature chondrocytes taken from either of the two areas marked by black boxes, measurements for hypertrophic chondrocytes taken from area marked by red box. (b,c) YM values for (b) immature and hypertrophic chondrocytes in wt and col11a2−/− (n = 3 for both) at 7 dpf and (c) adult bone from the operculum and jaw in wt (n = 8 and 3, respectively) and col11a2−/− (n = 6 and 3, respectively). (d) Ventral and lateral views of Alizarin red Alcian blue staining show GAGs in cartilage (stained in blue) and mineralization (stained in red) in wt and col11a2−/− fish at 5 and 7 dpf. Red asterisks indicate areas of bone formation. MC, Meckel's cartilage; PQ, palatoquadrate; C, ceratohyal; BA, branchial arches; HS, hyosymplectic; OC, otic capsule; OP, operculum; CL, cleithrum; PS, parasphenoid; NT, notochord tip; O, otoliths. Scale bar, 200 µm. (e) col10a1aBAC:citrine;col2:mCherry transgenic line shows type X (yellow) and type II (red) collagen in wt and col11a2−/− zebrafish at 7 dpf. Scale bar, 100 µm. (f) Quantification of col10a1-expressing cells in hypertrophic chondrocytes, IOM ligament cells and osteoblasts in the lower jaw at 7 dpf (position of each cell type shown by green, purple and orange arrows in (e), respectively) (n = 3 for all). (g) Quantification of col10a1-expressing hypertrophic chondrocytes in 7 dpf wt and col11a2−/− fish (n = 3 for all) (M, Meckel's cartilage; PQ, palatoquadrate; C, ceratohyal). Student's unpaired t-tests were performed in b, c, f and g, data are mean with s.e.m. (b shows mean with no s.e.m.). *p ≤ 0.05, **p ≤ 0.01, ***p ≤ 0.001.
|
