
Fig. 7
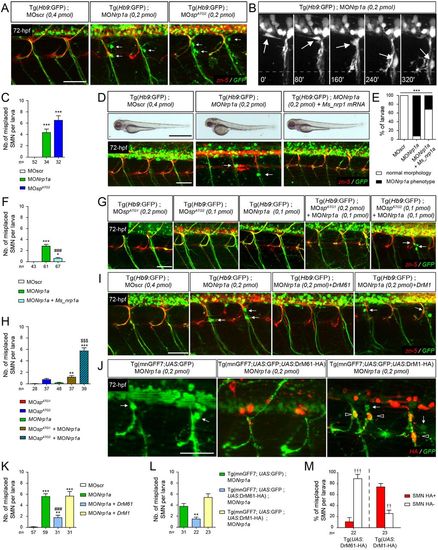
DrM61 acts as a downstream effector of neuropilin 1a signalling in motor neurons. (A-C) Neuropilin 1a (nrp1a) morphants show misrouted motor neuron somata similar to ATG2 morphants. (A) Analysis of secondary motor neurons (sMN) in 72 hpf Tg(Hb9:GFP) transgenic larvae injected with MOnrp1a, MOspATG2 or MOscr morpholinos using zn-5 and GFP antibodies. (B) Representative stills of time-lapse recordings showing SMN behaviour in 40-72 hpf Tg(Hb9:GFP) transgenic larvae injected with Nrp1a (n=5 larvae; n=32 spinal hemisegment monitored). Arrows track the aberrant migration of SMN somata along motor axon tracts of nrp1a morphants. Scale bar: 10 µm. (D-F) Rescue experiments of nrp1a morphant phenotypes with mouse Nrp1 mRNA (Ms_nrp1 mRNA). (D) Overall morphology (upper panels) and SMN analysis (bottom panels) of 72 hpf larvae injected with MOscr, MONrp1a or MONrp1a and Ms_nrp1 mRNA. (E) Distribution of wild-type and nrp1a morphant phenotypes in each injection group. ***P≤0.001; χ2 test. (F) Mean number of misplaced SMN somata per larvae. (G) SMN analysis in 72 hpf Tg(Hb9:GFP) transgenic larvae injected with sub-efficient doses of MOspATG1, MOspATG2 or MONrp1a or co-injected with the same sub-efficient doses of MONrp1a and MOspATG1 or MOspATG2 morpholinos. (I) SMN analysis in 72 hpf Tg(Hb9:GFP) transgenic larvae injected with control (MOscr) or MONrp1a morpholinos or co-injected with MONrp1a and DrM1- or DrM61-spastin mRNA. (J) SMN analysis in 72 hpf Tg(mnGFF7;UAS:GFP), Tg(mnGFF7;UAS:GFP;UAS:DrM61-HA) and Tg(mnGFF7; UAS:GFP;UAS:DrM1-HA) transgenic larvae using HA and GFP antibodies. (A,D,G,I,J) Lateral views of the trunk, anterior towards the left. Arrows indicate mispositioned SMN somata. Scale bars: 50 µm. (J) Empty arrowheads indicate misplaced HA-positive SMN. (C,F,H,K,L) Mean number of mispositioned SMN per larva (quantified on 24 spinal hemisegments/larva). (M) Percentage of misplaced HA-positive or -negative SMN per larva (quantified on 24 spinal hemisegments/larva). (C,F,H,K-M) The number of larvae or SMN analysed per group (n) is mentioned under each corresponding histogram bar. *P≤0.05, **P≤0.01, ***P≤0.001 versus internal controls; $$$P≤0.001 versus single injection of each morpholino; ###P≤0.001 versus morphant larvae; ††P≤0.01, †††P≤0.001 HA-positive versus -negative SMN; Kruskal–Wallis ANOVA test with Dunn's post test. Error bars are s.e.m. |
| Fish: | |
|---|---|
| Knockdown Reagents: | |
| Observed In: | |
| Stage Range: | Prim-25 to Protruding-mouth |