
Fig. 4
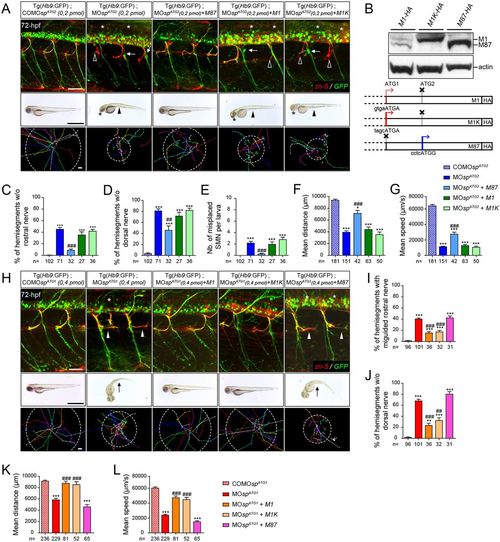
Spastin main isoforms have non-overlapping functions in spinal motor neuron development and locomotor behaviour. (A-G) Rescue experiments of ATG2 morphant phenotypes by M1, M1K or M87 mRNAs. (B) Western blot analysis (bottom panel) of exogenous spastin expression using an HA antibody in wild-type embryos injected with human spastin (SPG4) mRNAs used for rescue experiments and schematized in the upper panel. The Kozak sequence surrounding the first ATG of M1 transcript has been replaced by an optimal consensus sequence (M1K mRNA) to boost M1 expression. Actin was used as a loading control. (H-L) Rescue experiments of ATG1 morphant phenotypes by M1, M1K or M87 mRNAs. (A,H; upper panels) Immunolabelling of secondary motor neurons (sMN) in 72 hpf control, morphant and ‘rescued’ (i.e. co-injected with MOspATG1 or MOspATG2 together with each version of human spastin mRNAs) Tg(Hb9:GFP) larvae using zn-5 and GFP antibodies. (A) Arrows, empty arrowheads and asterisks indicate mispositioned sMN, missing rostral and dorsal nerves, respectively. (H) White arrowheads indicate misguided rostral nerves. Scale bars: 50 µm. (A,H; middle panels) Overall morphology of 72 hpf control, morphant and ‘rescued’ larvae. (A) Arrowheads indicate yolk tube agenesis and asterisks indicate smaller eyes. (H) Arrows indicate curved tails. Scale bars: 1 mm. (A,H; bottom panels) Tracking analysis of 72 hpf control, morphants and ‘rescued’ larvae in a touch-escape response test. Each line shows the trajectory of one larva after the stimulus. Dotted circle radius symbolizes the mean swimming covered distance. Scale bars: 1 mm. (C-G,I-L) Quantification of sMN defects (24 spinal hemisegments per larva; C-E,I,J), mean swimming distances covered (F,K) and speed (G,L) of 72-hpf control, morphant and ‘rescued’ larvae. The n value for each larval group is indicated under the corresponding histogram bar. *P≤0.05, **P≤0.01, ***P≤0.001 versus control larvae; ##P≤0.01, ###P≤0.001 versus morphants; Kruskal–Wallis ANOVA test with Dunn's post test. Error bars are s.e.m. |