
Fig. 4
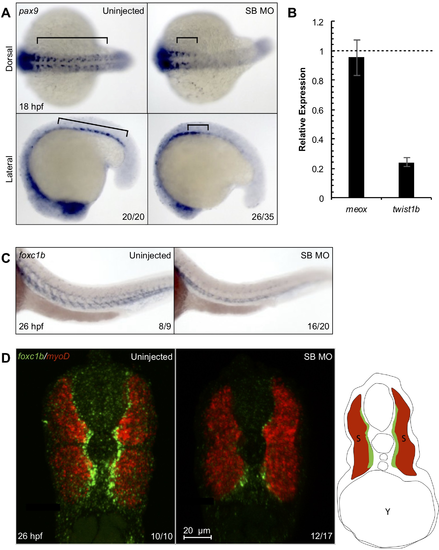
Snai2 SB morphants display depletion of sclerotome markers. pax9, a marker of the sclerotome, was analyzed by WISH at 18 hpf (A). Black brackets highlight the difference in staining between morphants and siblings. qPCR on somitic, GFP+ cells sorted from morphant and control Tg(actc1b:GFP) embryos at ~17 hpf showed the sclerotome marker twist1b was decreased, while the pan-somitic marker remained normal in morphants (B). Wish for foxc1b showed clear diagonal expression in the anterior portion of the somites of uninjected embryos, while morphants lacked this distinctive stripe pattern (C). Error bars are calculated from technical replicates. Double fluorescent in situ hybridization for foxc1b and myoD (myogenic marker) followed by razor cutting for confocal analysis showed that while the muscle marker is consistent in both morphants and uninjected embryos, there is a notable decrease of positive staining for foxc1b, especially within the dorsal portion of the somites. A small schematic is provided to show greater detail of how embryos are oriented in Fig D. Numbers in the lower right-hand corner of each image depict the number of embryos with the phenotype pictured out of the total number of embryos assayed in each condition. |
| Genes: | |
|---|---|
| Fish: | |
| Knockdown Reagent: | |
| Anatomical Terms: | |
| Stage Range: | 14-19 somites to Prim-5 |
| Fish: | |
|---|---|
| Knockdown Reagent: | |
| Observed In: | |
| Stage Range: | 14-19 somites to Prim-5 |