
Fig. 2
- ID
- ZDB-FIG-181004-12
- Publication
- Severi et al., 2018 - Investigation of hindbrain activity during active locomotion reveals inhibitory neurons involved in sensorimotor processing
- Other Figures
- All Figure Page
- Back to All Figure Page
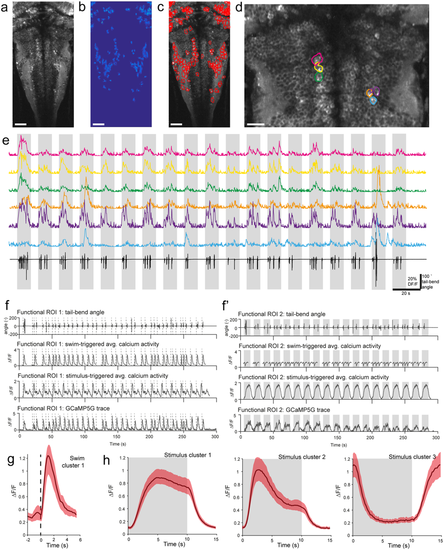
Automatic extraction of calcium signals and clustering analysis reveal different responses to the stimulus presentation as well as recruitment during locomotion. (a) Standard deviation of time series obtained from an example plane of calcium imaging data. (b) Spatial map of a subset of active regions extracted from that plane. (c) Red outlines are borders of automatically detected functional ROIs. (d) Zoom on some example regions of interest (ROIs) from the same plane as (a–c). (e) Six different example ROIs (colors match locations in panel (d)) plotted for the full length of the trial. Periods of optomotor stimulus motion are indicated by grey bars. Tail trace is plotted below in black. (f) Sample functional ROIs that show activity during visuomotor behavior. From top to bottom: tail-bend angle, swim-triggered average calcium activity, stimulus-triggered average calcium activity, GCaMP5G ΔF/F trace. Individual bout starts are marked with a vertical dotted line. This functional ROI (1) correlates better with swim-events than with the visual stimulus. (f ’) Same as (f ) but for a different functional ROI (2) which correlates better with the stimulus than with swim events. Periods of optomotor stimulus motion are indicated by grey bars. (g) Cluster mean from clustering swimming-related activity. Dotted line indicates bout start. Red shaded area around solid black line (mean) indicates +/− S.E.M (n = 144 ROIs from 7 larvae). (h) Cluster means from clustering stimulus related activity. Grey shaded area indicates when stimulus is moving. Red shaded area around black line (mean) indicates +/− S.E.M (swim cluster 1: n = 466 ROIs from 10 larvae, swim cluster 2: n = 161 ROIs from 10 larvae, swim cluster 3: n = 76 ROIs from 8 larvae). Scale bars are 40 µm in (a–c), and 20 µm in (d). |