
FIGURE
Fig. 1
- ID
- ZDB-FIG-180920-18
- Publication
- Crespo et al., 2018 - A novel transgenic zebrafish line for red opsin expression in outer segments of photoreceptor cells
- Other Figures
- All Figure Page
- Back to All Figure Page
Fig. 1
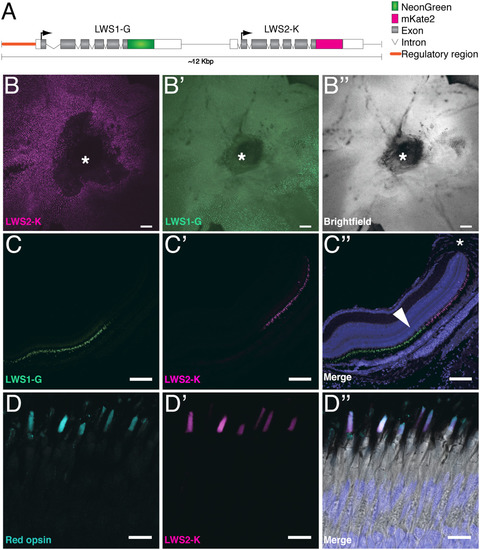
LWS1‐G and LWS2‐K are detected in outer segment of photoreceptor cells. A: Schematic illustration of Tg(LWS) (∼12 Kb, not to scale). Opn1lw1 and Opn1lw2 are C‐terminally fused to mNeonGreen and mKate2, respectively. The regulatory region (orange line) as defined by Tsujimura et al. (2010). The arrow depicts the orientation of the ORF. B–B″: Flat‐mounted retina of Tg(LWS) with LWS2‐K in magenta, LWS1‐G in green, and brightfield in gray. Asterisks outline the optic nerve of the retina. C–C″: Retinal section of an adult Tg(LWS) transgenic fish, ventral to the optic nerve (asterisk in C″). C″ shows the merge of C, C′, and DAPI staining (blue). Fluorescence of LWS1‐G is marked in green and LWS2‐K in magenta. Arrowhead in C″ highlights the outer nuclear layer. D–D″: Section of a Tg(LWS) adult retina showing staining with a red opsin antibody (cyan, D, D″) and fluorescence of LWS2‐K (magenta, D′, D″). D″ shows the merge of red opsin antibody staining (cyan), LWS2‐K fluorescence (magenta), DAPI staining (blue), and brightfield images. Scale bars B–C″ = 100 μm. Scale bars D–D″ = 10 μm.
|
Expression Data
Expression Detail
Antibody Labeling
Phenotype Data
Phenotype Detail
Acknowledgments
This image is the copyrighted work of the attributed author or publisher, and
ZFIN has permission only to display this image to its users.
Additional permissions should be obtained from the applicable author or publisher of the image.
Full text @ Dev. Dyn.