
FIGURE
Fig. 2
- ID
- ZDB-FIG-180920-17
- Publication
- Crespo et al., 2018 - A novel transgenic zebrafish line for red opsin expression in outer segments of photoreceptor cells
- Other Figures
- All Figure Page
- Back to All Figure Page
Fig. 2
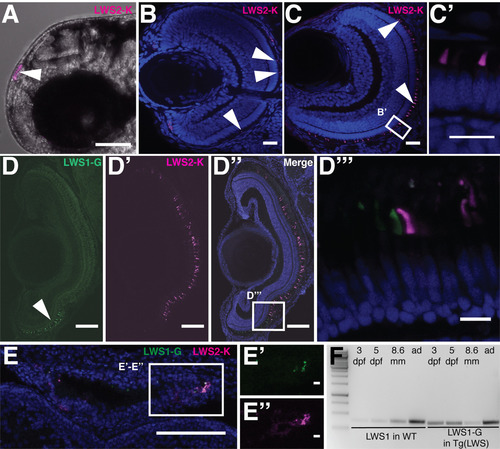
LWS1‐G and LWS2‐K protein expression during Zebrafish retinal development. A: LWS2‐K expression in the pineal gland (arrowhead) of a live Zebrafish embryo at 2 dpf. B–C: Retinal section of Tg(LWS) at 3 dpf with LWS2‐K in magenta and DAPI in blue. White arrowhead points to LWS2‐K in outer segment. D–D′: Retina of a Tg(LWS) animal of 8.6‐mm standard length, showing LWS1‐G in green and LWS2‐K in magenta. D″: Merge of D and D′ with DAPI in blue. D″′: Zoom in on boxed area in D″. E: Overview of a pineal gland of a Tg(LWS) larva at 8.6‐mm standard length with LWS2‐K in magenta, LWS1‐G in green, and DAPI in blue. E′–E″: Zoom in on boxed area in E. F: Reverse transcription polymerase chain reaction results for wild‐type (lane 2 to 5) and TG(LWS) (lane 6 to 9) littermates. cDNA was prepared from 3‐dpf, 5‐dpf, 8.6‐mm standard‐length larvae and adult retinas (ad). Wild‐type amplicons were obtained using opn1lw1 specific primers. TG(LWS) Polymerase chain reaction products were amplified using mNeonGreen specific primers. Lane 1: marker. Scale bar A = 1 mm. Scale bars B, C, D‐D″, E =100 μm. Scale bars D″′, E′, E″ = 10 μm. Scale bar C′ = 10 μm.
|
Expression Data
Expression Detail
Antibody Labeling
Phenotype Data
Phenotype Detail
Acknowledgments
This image is the copyrighted work of the attributed author or publisher, and
ZFIN has permission only to display this image to its users.
Additional permissions should be obtained from the applicable author or publisher of the image.
Full text @ Dev. Dyn.