
Fig. 8
- ID
- ZDB-FIG-180918-29
- Publication
- Xing et al., 2018 - Mutational analysis of dishevelled genes in zebrafish reveals distinct functions in embryonic patterning and gastrulation cell movements
- Other Figures
- All Figure Page
- Back to All Figure Page
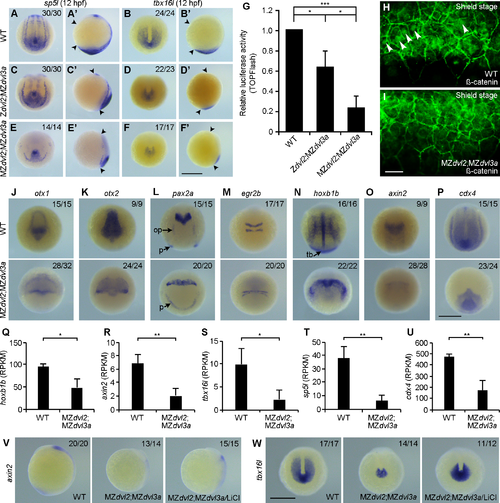
Cooperation of maternal and zygotic Dvl2 and Dvl3a in AP patterning. Mutant embryos were selected by the extent of CE defects at 12 hpf, and genotyped after in situ hybridization. Immunostaining was performed at shield stage, followed by genotyping. (A-B’) Expression patterns of sp5l and tbx16l in WT embryos. Arrowheads in lateral viewed embryos indicate the anterior end and posterior end. Other embryos are dorsal-posterior view. (C, C’) The expression of sp5l is not affected in Zdvl2;MZdvl3a mutants. (D, D’) Strongly reduced tbx16l expression in Zdvl2;MZdvl3a mutants. (E, E’) Strongly reduced sp5l expression in MZdvl2;MZdvl3a mutants. (F, F’) Residual expression of tbx6l in MZdvl2;MZdvl3a mutants. (G) TOPFlash luciferase reporter activity in Zdvl2;MZdvl3a and MZdvl2;MZdvl3a mutants at 12 hpf. Bars represent the mean ± s.d. from three independent experiments (*, P<0.05; ***, P<0.001). (H) Endogenous ß-catenin nuclear accumulation (arrows) in ventral marginal cells of a WT embryo at shield stage. (I) Absence of ß-catenin nuclear accumulation in ventral marginal cells of an MZdvl2;MZdvl3a mutant at shield stage. (J-P) In situ hybridization analysis of indicated genes in WT and MZdvl2;MZdvl3a embryos at 12 hpf. Dorsal view with anterior to the top (J, K), dorsal view (L-O), and dorsal-posterior view (P). (R-U) Analysis of hoxb1b and zygotic Wnt/ß-catenin target genes by RNA-sequencing at 12 hpf. Note the significant decrease in RPKM (reads per kilobase million) for these genes in MZdvl2;MZdvl3a mutants. Bars represent the mean ± s.d. from three independent samples (*, P<0.05; **, P<0.01). (V, W) Lateral (V) and dorsal-posterior (W) views show rescue of axin2 and tbx16l expression in MZdvl2;MZdvl3a mutants at 12 hpf, following LiCl (0.3 M) treatment for 8 minutes at 5 hpf. op, otic placode; p, pronephric mesoderm; tb, tailbud. Scale bar: (A-F’) 400 μm; (H, I) 20 μm; (J-P) 400 μm; (V, W) 400 μm. |
| Genes: | |
|---|---|
| Antibody: | |
| Fish: | |
| Condition: | |
| Anatomical Terms: | |
| Stage Range: | Shield to 5-9 somites |
| Fish: | |
|---|---|
| Observed In: | |
| Stage Range: | Shield to 5-9 somites |