
Fig. 5
- ID
- ZDB-FIG-180821-49
- Publication
- Fukui et al., 2018 - Hippo signaling determines the number of venous pole cells that originate from the anterior lateral plate mesoderm in zebrafish
- Other Figures
- All Figure Page
- Back to All Figure Page
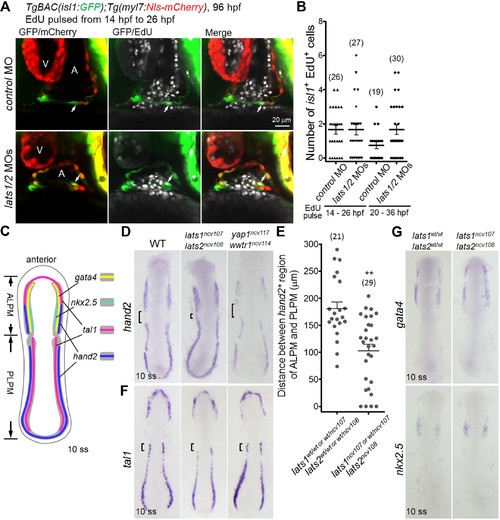
Knockout of lats1/2 leads to an increase in the expression of hand2 in the boundary between ALPM and PLPM. (A) Single-scan confocal images (at 96 hpf) of the TgBAC(isl1:GFP);Tg(myl7:Nls-mCherry) embryos injected with MO and pulsed with EdU from 14 hpf to 26 hpf. Arrows indicate the EdU-incorporated isl1- and myl7-promoter-active cells in the IFT of the atrium. A, atrium; V, ventricle. Ventral view, anterior to the top. (B) The number of EdU-positive isl1-promoter-active CMs among the embryos treated with MO. Embryos pulsed with EdU from 14 hpf to 26 hpf (left two columns) and from 20 hpf to 36 hpf (right two columns). (C) Schematic illustration of gene expression patterns in the LPM of wildtype (WT) embryos at 10 somite stage (ss). Expression domain of tal1, gata4, nkx2.5 and hand2 are depicted as magenta, yellow, green, and blue, respectively. Dorsal view, anterior to the top. (D, F, G) WISH analyses of the embryos at 10 ss using the antisense probes indicated to the left of the panels. (D, F) Genotypes are WT (left panels, n = 8 to 18), lats1/2 DKO (center panels, n = 6 to 13), and yap1/wwtr1 DKO (right panels, n = 5 to 7). (D) Square brackets indicate the gap between hand2-positive regions of ALPM and PLPM. (E) Quantitative measurement of the distance indicated by the brackets in (D) in either the lats1wt/wtlats2wt/wt embryos or the lats1 wt/ncv107lats2 wt/ncv108 embryos and in either the lats1wt/ncv107lats2ncv108 or the lats1/2 DKO embryos. (F) Brackets indicate the tal1-positive rostral end of PLPM in the WT. (G) Genotypes are WT (left panels, n = 4 to 5) and lats1/2 DKO (right panels, n = 3 to 4). Dorsal view, anterior to the top. The single-scan (2 μm) confocal images and in situ hybridization (ISH) images are a set of representative images of at least four independent experiments. **p < 0.01. |
| Genes: | |
|---|---|
| Fish: | |
| Knockdown Reagents: | |
| Anatomical Terms: | |
| Stage Range: | 10-13 somites to Day 4 |
| Fish: | |
|---|---|
| Observed In: | |
| Stage: | 10-13 somites |