
Fig. 1
- ID
- ZDB-FIG-180801-15
- Publication
- LLeras Forero et al., 2018 - Segmentation of the zebrafish axial skeleton relies on notochord sheath cells and not on the segmentation clock
- Other Figures
- All Figure Page
- Back to All Figure Page
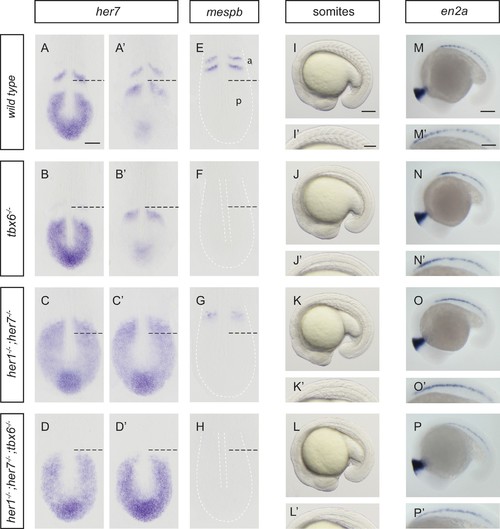
Disruption of the segmentation clock in tbx6, her1;her7 and her1;her7;tbx6 mutants. (A–D’) In situ hybridization for segmentation clock marker her7. (B and B') her7 oscillates in the posterior PSM of tbx6−/−, but does not oscillate in her1−/−;her7−/− (C and C´) or her1−/−;her7−/−;tbx6−/− (D and D`). (E–H) In situ hybridization for segmental output marker mespb. mespb is not expressed in tbx6−/− (F) or her1−/−;her7−/−;tbx6−/− (H), but is weakly expressed in her1−/−;her7−/−, albeit not in segmental stripes (G). (I–L’) Somite boundaries in the paraxial mesoderm. In tbx6−/− (J), her1−/−;her7−/− (K) and her1−/−;her7−/−;tbx6−/− (L) mutants, boundaries lose periodic order. (M–P’) Spatial distribution of muscle pioneers marked by in situ hybridization with en2a. In tbx6−/− (N), her1−/−;her7−/− (O) and her1−/−;her7−/−;tbx6−/− (P) muscle pioneers lose segmental pattern. A-H’ are dorsal views of 13.5 hpf (10 somites) embryos, I-P' are lateral views of 18–19.5 hpf (18–20 somites) embryos. a – anterior, p – posterior. Scale bar in A is 100 µm and applies to A-G. Scale bar in I is 150 µm, applies to I-L and in I’ is 100 µm, applies to I’-L’. Scale bars in M and M’ are 150 µm and 100 µm respectively, and apply to M-P and M’-P’ respectively. |
| Genes: | |
|---|---|
| Fish: | |
| Anatomical Terms: | |
| Stage Range: | 5-9 somites to 20-25 somites |
| Fish: | |
|---|---|
| Observed In: | |
| Stage Range: | 5-9 somites to 20-25 somites |