
Fig. S5
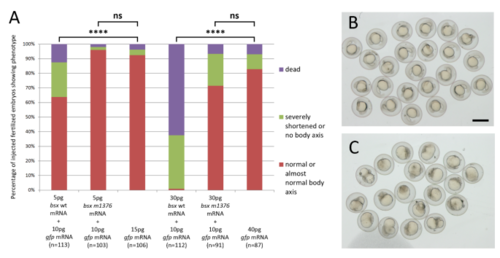
Evaluation of biological activities of bsx wildtype mRNA and bsx m1376 mRNA by microinjection at one-cell state. (A-C) Embryos were injected with bsx wildtype or bsx m1376 mRNA in combination with gfp mRNA, such that in a first injection series a total of 15 pg mRNA, and in a second series a total of 40 pg mRNA were injected into each embryo. Embryos were analyzed at 24 hpf and the phenotypes classified into “normal or almost normal body axis” (examples show in (B)), “severely shortened or no elongated axis at all” (examples show in (C)), or “dead”. Scale bar in B for B,C: 500 µm. (A) Graph displays proportions of phenotypic classes at 24 hpf in all embryos injected. Embryos were injected with 5 pg synthetic bsx wildtype mRNA and 10 pg gfp mRNA, 5 pg synthetic bsx m1376 mRNA and 10 pg gfp mRNA or 15 pg gfp mRNA as control. Additionally, embryos were injected 30 pg synthetic bsx wildtype mRNA and 10 pg gfp mRNA, 30 pg synthetic bsx m1376 mRNA and 10 pg gfp mRNA or 40 pg gfp mRNA as control. Chi-square test (GraphPad Prism) revealed significant differences between bsx wildtype mRNA injected embryos and controls at both 5 pg and 30 pg amounts injected (p < 0.0001). In contrast no significant differences were detected between phenotypes of bsx m1376 mRNA and control injected embryos at both 5 and 30 pg bsx m1376 mRNA injected (p = 0.5232 and p = 0.1085, respectively). These findings suggest that bsx m1376 mRNA lacks the biological activity of Bsx. |