
Fig. S3
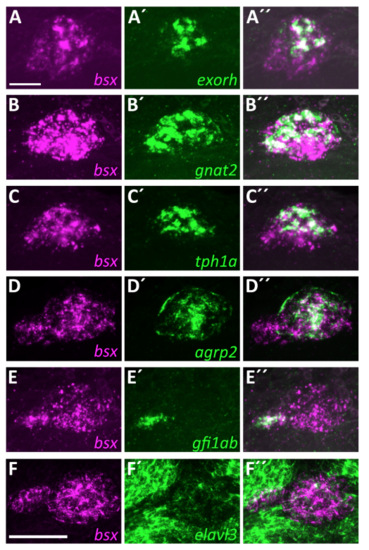
Evaluation of expression domains of bsx and pineal differentiation marker genes. Double fluorescent in situ hybridization using 3 dpf wildtype embryos reveals bsx (A-F, magenta) and differentiation marker (A’-F’, green) expression (both channels A’’ - F’’). Images show maximum intensity projections of dorsal view confocal image stacks of pineal complex (same stacks from which single planes are shown in Fig. 2). The z-projections suggest clustering of specific cell types in the pineal complex. We integrated this clustering into our model of pineal complex cell type organisation (Fig. 8B). For each marker, two or more embryos were analyzed. Scale bar: 20 µm. |