FIGURE

Fig. 1

ID
ZDB-FIG-180529-27
Publication
Bajanca et al., 2017 - Epigenetic Regulators Modulate Muscle Damage in Duchenne Muscular Dystrophy Model
Other Figures
All Figure Page
Back to All Figure Page
Fig. 1

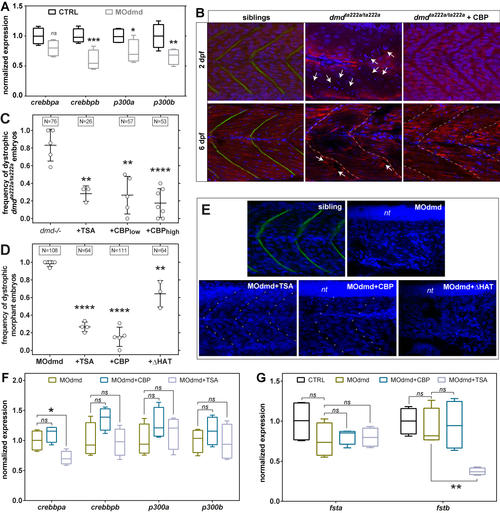
Epigenetic regulators in zebrafish dystrophic embryos.

A) Quantitative PCR analysis of p300/CBP transcript expression at 2 days post fertilisation (dpf) in control and morpholino-depleted embryos (MOdmd). (B) Confocal sections of Tg(actc1b:mCherry)pc4 embryos immunostained for Dystrophin (green). Well organised pattern of muscle fibres (mCherry, red) and nuclei (DAPI, blue) in siblings, while heavily disrupted in dmdta222a/ta222a embryos (arrows), showing collapsed and wavy fibres which ends misalign with somatic borders (dashed lines). Overexpressing CBP (dmdta222a/ta222a + CBP; injection of 107 RNA molecules of plasmid per embryo at one cell stage) has a clear positive effect on dystrophic embryos both at 2 and 6 dpf. (C, D) Frequency of dystrophic phenotype (see Materials and Methods) on 2 dpf Dystrophin-null embryos, either dmdta222a/ta222amutants (C) or depleted with MOdmd (D). Overexpressing CBP (low = 107, high = 108 molecules of plasmid RNA injected per embryo) rescues the dystrophic phenotype of both dmdta222a/ta222a(C) and morphant (D; 107 molecules) embryos as efficiently as blocking HDACs (TSA), even at lower concentrations (C,D). A mutated CBP form lacking the HAT domain (ΔHAT; 107 molecules) significantly decreases the rescue efficiency (C). Individual values for independent experiments are plotted, bars represent the average ± SD and boxes above plots indicate total number of embryos analysed. (E) Representative confocal sections of 2 dpf embryos immunostained for Dystrophin (green) to confirm Dystrophin presence in siblings and depletion in MOdmd embryos, counterstained with DAPI (blue). Both TSA (200 nM) and CBP (107 molecules) are able to rescue the muscle phenotype of MOdmd embryos, while ΔHAT injected embryos most often show muscle damage (107 molecules). nt = neural tube. (F,G) Quantitative PCR analysis of crebbp, p300 and follistatin endogenous transcripts expression at 2 dpf. See text for details on ANOVA (A,F,G) or T tests (B,C), performed with cut-offs: (*) < 0.05, (**) < 0.005, (***) < 0.001, (****) < 0.0001. ns = non significant.

Expression Data
Genes:
Antibody:
Fish:
Condition:
Knockdown Reagents:
Anatomical Terms:
Stage Range: Long-pec to Day 6

Expression Detail
Antibody Labeling
Phenotype Data
Fish:
Condition:
Knockdown Reagents:
Observed In:
Stage Range: Long-pec to Day 6

Phenotype Detail
Acknowledgments
This image is the copyrighted work of the attributed author or publisher, and ZFIN has permission only to display this image to its users. Additional permissions should be obtained from the applicable author or publisher of the image. Full text @ PLoS Curr.