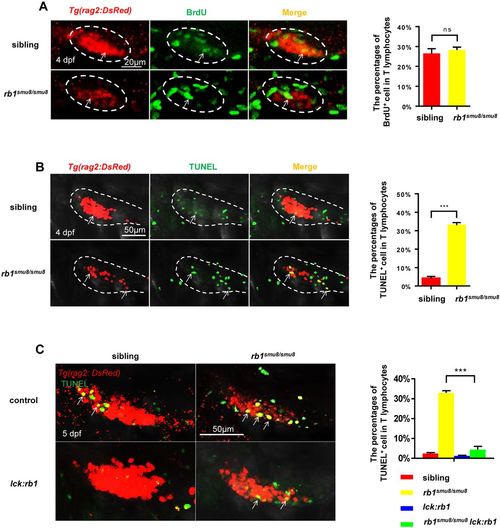
Excessive apoptotic early T lymphocytes in the thymus of rb1smu8/smu8 mutants. (A) Double staining of BrdU/rag2-dsRed show BrdU incorporation of T cells in 4 dpf siblings and rb1smu8/smu8 mutants (left). The white ovals indicate the thymus region. The white arrows indicate proliferative T cells. Scale bars: 20 μm. The graph shows the percentages of rag2:DsRed+ T cells that incorporate BrdU (mean± s.e.m.; ns, not significant; n=10). (B) Double staining of TUNEL/rag2-dsRed shows TUNEL incorporation by T-cells in 4 dpf siblings and rb1smu8/smu8 mutants. The broken line outlines the thymus region. The white arrows indicate apoptotic T cells. Scale bar: 50 μm. The graph shows the percentages of rag2:DsRed+ T cells that incorporate TUNEL (mean±s.e.m.; ***P<0.001; n=9). (C) Confocal images of T cells (red) exhibiting cell apoptosis (overlap of TUNEL staining) of siblings and rb1smu8/smu8 mutant embryos injected with control or pTol-lck:rb1 plasmid at 5 dpf. Scale bars: 50 μm. The graph shows the percentages of T cells (red) exhibiting cell apoptosis (overlap of TUNEL staining) in siblings and rb1smu8/smu8 mutant embryos injected with control or pTol-lck:rb1 plasmid (mean±s.e.m.; ***P<0.001; n=10).
|
