
Fig. 6
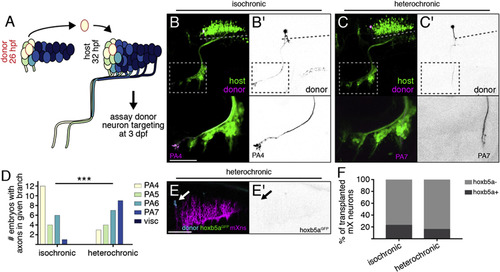
Time of mX Axon Outgrowth Determines Peripheral Target Independently of hox5 Expression (A) mX neurons are transplanted from anterior to anterior (homotopic) from a 26 hpf donor to a 32 hpf host, and donor axon targeting is assayed at 3 dpf. (B and C) Anterior mX neurons transplanted isochronically (B) innervate anterior targets whereas anterior mX neurons transplanted heterochronically (C) innervate posterior targets. Donor neurons are marked by Tg(isl1:Kaede) (magenta; B′ and C′, black). Host motor neurons are marked by Tg(isl1:GFP) (green). Dotted lines indicate length of mX territory. Dotted boxes indicate region shown in bottom panels. (D) Quantification of transplant results. Isochronic control transplants are the same data shown in Figure 2F (anterior → anterior). Analysis was done using Fisher’s exact test; see STAR Methods for details. Isochronic: n = 14 host embryos; heterochronic: n = 16. (E) Change in targeting after heterochronic transplantation is not due to induction of hox5 expression. Transgenes are as described in Figures 3F and 3G. (F) Quantification of (E). Isochronic control transplants are the same data shown in Figure 3F. Heterochronic: n = 19 cells, 11 embryos. |