
Fig. 4
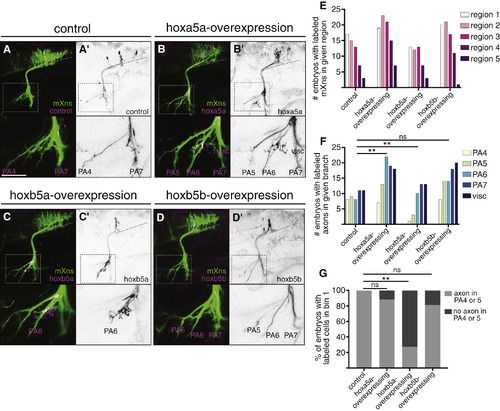
hox5 Expression Directs mX Axons to Posterior Targets (A–D) Expression of control isl1:eGFPCAAX (A) or isl1:hox5-P2A-eGFPCAAX expression construct (B–D, magenta; A′–D′, black) in a Tg(isl1:mRFP) background (green). Dotted lines indicate length of mX territory; dotted boxes indicate region shown in bottom panels. (E) Quantification of distribution of labeled neurons after hox5 expression as in (A)–(D). Regions are based on morphological boundaries as in Figure S1. (F) Quantification of labeled axon targeting in (A)–(D). Analysis was done using Fisher’s exact test comparing control to each ectopic expression condition with respect to each axon branch. Conditions are considered different if they differ in at least one branch. In both (E) and (F), control n = 17 embryos, hoxa5a n = 24, hoxb5a n = 20, and hoxb5b n = 28. (G) Analysis of axon targeting in cases where a labeled mX neuron was located within the most anterior region of the mX territory (bin 1; see Figure 1I). Ectopic hoxb5a-expressing mX neurons in bin 1 avoid PA4 and PA5. Analysis was done by Chi-square followed by Fisher’s exact test comparing each hox5 construct to control. Control n = 9 embryos, hoxa5a n = 17, hoxb5a n = 11 embryos, and hoxb5b n = 16. |