
Fig. 2
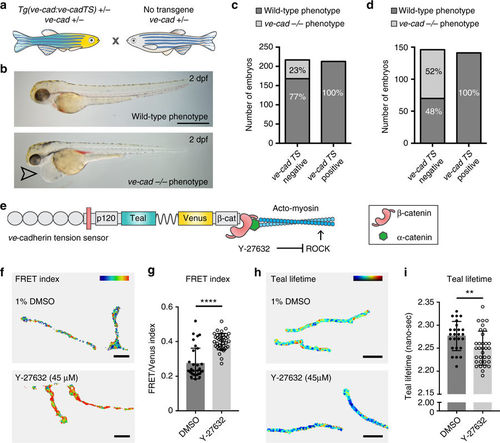
VE-cadherin-TS is functional and under acto-myosin controlled tension. a Schematic representation of genetic cross to test functionality of VE-cadherin-TS. b Wild-type (top) and ve-cadherin mutant (bottom) phenotype at 2 dpf (arrowhead indicates cardiac oedema in mutant). Scale bar = 1 mm. c Phenotypic scoring all embryos (n = 430) collected from cross in a, showing 23% phenotypic mutants (n = 49/217) in TS-negative population (n = 217) and 0% (n = 0/213) in TS-positive siblings (n = 213). d Phenotypic scoring of n = 286 embryos from a cross between a Tg(ve-cad:ve-cadTS)+/−, cdh5 ubs8−/− mutant and a non-transgenic cdh5 ubs8+/− animal. In the TS negative population 52% (n = 76/146) displayed the mutant phenotype whilst there were no phenotypic mutants in the TS positive clutch (n = 141). e Schematic representation of Y-27632 (ROCK inhibitor) acto-myosin inhibition. f Heatmap image of ratio-metric FRET values in junctions of 1%DMSO and Y-27632 (45 μM/1%DMSO) treated embryos. Colors range from blue ( = low FRET index/high tension) to red ( = high FRET index/low tension). Scale bar = 5 μm. g Quantification of ratio-metric FRET values in junctions of 1 % DMSO (n = 4) versus Y-27632 (45 μM/1%DMSO) (n = 5) treated embryos. Each data point represents a junctional region of interest (ROI), n = 33 junctions selected from DMSO control embryos and n = 40 selected in Y-27632 treated embryos. Treatment for 5 h prior to imaging. Error bars represent mean ± s.d.; ****p < 0.0001 from unpaired two-sided Mann–Whitney test. h Heatmap image of Teal lifetime values in junctions of 1%DMSO (top) and Y-27632 (bottom, 45 μM/1%DMSO)- treated embryos. Colors range from blue ( = low lifetime/low tension) to red ( = high lifetime/high tension). Scale bar = 5μm. i Quantification of Teal lifetime values (nano-sec) in junctions of 1 % DMSO (n = 4) versus Y-27632 (45 μM/1%DMSO) (n = 4) treated embryos. Each data point represents a single junctional ROI, n = 25 junctions segmented from DMSO control embryos and n = 33 from Y-27632 treated embryos. Treatment for 5 h prior to imaging. Error bars represent mean ± s.d.; **p = 0.0060 from unpaired two-sided t test |