
Fig. 1
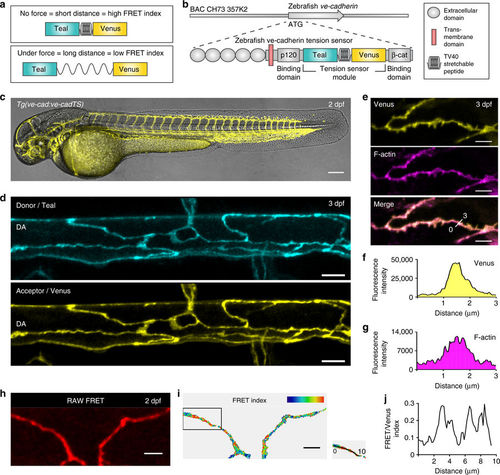
VE-cadherin-TS is localized to cell-cell junctions and reports a differential FRET signature. a Schematic representation of the tension sensor (TS) module. The Donor fluorescent protein, Teal, is separated from the acceptor, Venus, by a stretchable linker peptide (top). When the module is under tension (bottom), energy transfer from Teal to Venus will decrease. b Schematic of zebrafish VE-cadherin-TS cDNA recombined into the ve-cadherin BAC clone. c Venus expression from Tg(ve-cad:ve-cadTS) throughout the blood vasculature at 2 dpf. Scale bar = 150 μm. d Maximum projection of the dorsal aorta (DA) at 3 dpf showing expression of Teal (top) and Venus (bottom) localized at cell–cell junctions. Scale bar = 10 μm. e Co-expression (Merge, bottom) of Venus (yellow, top) from Tg(ve-cad:ve-cadTS) and Tg(fli1ep:lifeact-mCherry), labeling F-actin (purple, middle), in endothelial junctions at 3 dpf. Scale bar = 5 μm. f–g Fluorescence intensity of Venus (f) and Tg(fli1ep:lifeact-mCherry), labeling F-actin (g), along a single 3 μm line-region in a single Z-section (shown in e). h RAW FRET signal at endothelial junctions at 2 dpf. Scale bar = 5 μm. i Ratio-metric FRET signal at 2 dpf in endothelial junctions (shown in h). Scale bar = 5 μm. j Variable ratio-metric FRET values along a single 10 μm line-region in a single Z-section in a proportion of the junction (boxed in i) |