
Fig. 8
- ID
- ZDB-FIG-180131-25
- Publication
- Hur et al., 2017 - microCT-based phenomics in the zebrafish skeleton reveals virtues of deep phenotyping in a distributed organ system
- Other Figures
- All Figure Page
- Back to All Figure Page
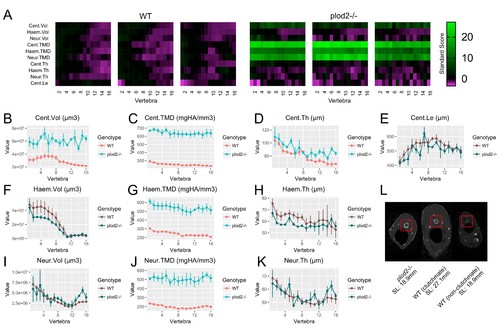
Analysis of plod2-/- fish following removal of allometric effects of body size. (A) Skeletal barcodes for WT and plod2-/- fish following removal of allometric effects of body size (n = 3/group). (B–K) Phenotypic features as a function of vertebra (mean ± SE, n = 3/group). Phenotypic data in WT sibling controls were subjected to allometric normalization; data in plod2-/- fish are identical to those in Figure 6. Plots associated with a significant difference are colored in a lighter coloring scheme (see text for p-values). Values for TMD were derived by a two-step process in which TMC and volume were subjected to allometric normalization independently, and normalized values for TMC and volume were used to calculate normalized values for TMD. The same plots with y axis set to zero are shown in Figure 8—figure supplement 1. (L) Transverse sections of microCT scans. Centra are highlighted by a red box in each animal. plod2-/- mutants (left) exhibit increased centrum diameter compared to standard length matched, non-clutchmate WT controls (right), and to a lesser extent, WT siblings (middle) of greater standard length. Images show posterior endplate of the sixth precaudal vertebra in all fish. |
| Fish: | |
|---|---|
| Observed In: | |
| Stage: | Adult |