
Fig. 5
- ID
- ZDB-FIG-180131-23
- Publication
- Hur et al., 2017 - microCT-based phenomics in the zebrafish skeleton reveals virtues of deep phenotyping in a distributed organ system
- Other Figures
- All Figure Page
- Back to All Figure Page
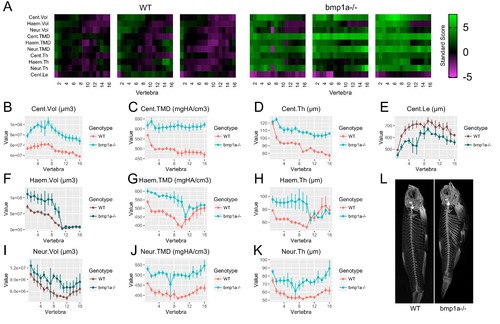
Analysis of bmp1a-/- fish. (A) Skeletal barcodes for WT and bmp1a-/- fish (n = 3/group). Each barcode represents a single fish. Standard scores are computed as the difference between the value of the feature in the individual and the mean value of the feature across all vertebrae in the control population, divided by the standard deviation of the feature across all vertebrae in the control population (see text for details). (B–K) Phenotypic features plotted as a function of vertebra (mean ± SE, n = 3/group). Plots associated with a significant difference are colored in a lighter coloring scheme (see text for p-values). The same plots with y axis set to zero are shown in Figure 5—figure supplement 2. (L) Maximum intensity projection of microCT scans. |