
FIGURE
Fig. 6
- ID
- ZDB-FIG-180131-24
- Publication
- Hur et al., 2017 - microCT-based phenomics in the zebrafish skeleton reveals virtues of deep phenotyping in a distributed organ system
- Other Figures
- All Figure Page
- Back to All Figure Page
Fig. 6
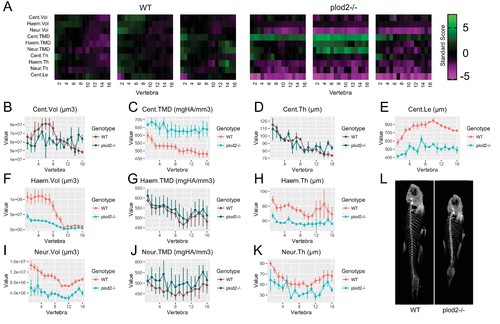
Analysis of plod2-/- fish. (A) Skeletal barcodes for WT and plod2-/- fish (n = 3/group). WT fish in this figure are different from those in Figure 5. (B–K) Phenotypic features plotted as a function of vertebra (mean ±SE, n = 3/group). Plots associated with a significant difference are colored in a lighter coloring scheme (see text for p-values). The same plots with y axis set to zero are shown in Figure 6—figure supplement 1. (L) Maximum intensity projection of microCT scans. |
Expression Data
Expression Detail
Antibody Labeling
Phenotype Data
| Fish: | |
|---|---|
| Observed In: | |
| Stage: | Adult |
Phenotype Detail
Acknowledgments
This image is the copyrighted work of the attributed author or publisher, and
ZFIN has permission only to display this image to its users.
Additional permissions should be obtained from the applicable author or publisher of the image.
Full text @ Elife