
Fig. 2
- ID
- ZDB-FIG-180118-22
- Publication
- Bayramli et al., 2017 - Patterned Arrangements of Olfactory Receptor Gene Expression in Zebrafish are Established by Radial Movement of Specified Olfactory Sensory Neurons
- Other Figures
- All Figure Page
- Back to All Figure Page
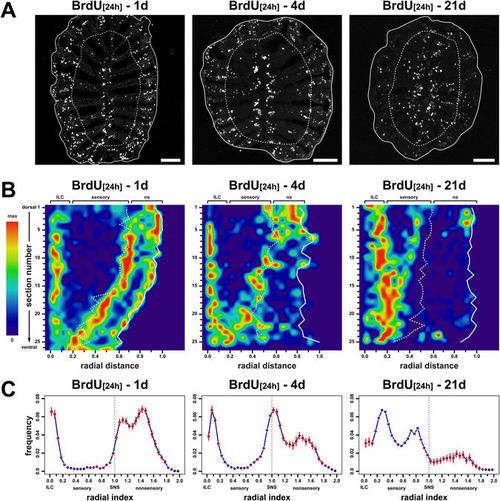
Adult-born cells invade the sensory epithelium over time. (A) Immunohistochemistry against BrdU following 24 h BrdU incubation 1d (left), 4d (centre), and 21d post labelling on sections through the adult OE. The dotted line indicates the position of the sensory/nonsensory border and the solid line demarcates the outline of the section. BrdU-positive cells are located at the interlamellar curves (centre of the sections) and peripherally to the sensory/nonsensory border initially but progressively invade the sensory OE. Scale bars: 100 µm. (B) Reconstructions of surface views onto a standardized olfactory lamella as shown in Fig. 1A 1d (left), 4d (centre), and 21d (right) following BrdU incubation for 24 h. The radial positions of BrdU-positive cells (left to right) were normalized to the maximum radius of the OE (radial distance) and plotted individually for each of 25 to 26 consecutive sections from the dorsal (top) to the ventral (bottom) margin of the OE. The circumference of the OE is indicated by a solid white line, the dotted line demarcates the average position of the SNS from all lamellae on the respective section. The frequency of BrdU-positive cells within each bin was normalized to the total number of BrdU-positive cells per section (max). The image has been smoothened with a bicubic scaling function. For a representation of unprocessed data see Supplementary Figure 2. (C) Frequency distributions of BrdU-positive cells 1d (left), 4d (centre), and 21d (right) following 24 h BrdU incubation. The position of labelled cells was normalized to the distance of the sensory/nonsensory border (SNS) from the tip of the interlamellar curves (ILCs). The dotted line demarcates the position of the SNS. Data points represent means ± SEM for 14.365 (1d), 10.967, (4d), and 7.463 (21d) cells from 30 sections of 3 OE for each time point. BrdU-positive cells originating from the ILC and SNS progressively invade the sensory OE over time, while cells in the periphery of the OE remain stationary. An additional population of non-migratory cells becomes visible at the ILC for the 21d time point. |