
Fig. 5 S2
- ID
- ZDB-FIG-180103-23
- Publication
- Sidhaye et al., 2017 - Concerted action of neuroepithelial basal shrinkage and active epithelial migration ensures efficient optic cup morphogenesis
- Other Figures
- All Figure Page
- Back to All Figure Page
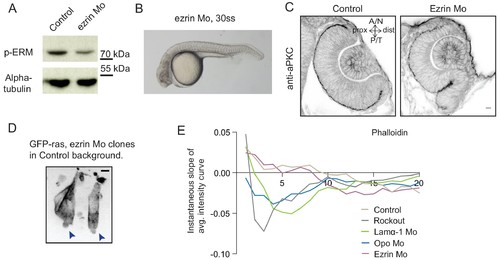
Analysis of ezrin morphant condition. (A) Western blot for p-ERM and alpha tubulin in control and ezrin morphant. (B) Brightfield image of Ezrin morphant embryo at 30 ss stage. (C) Confocal scan of 30 ss RNE in control (left), ezrin morphant (right) stained for aPKC. Morphant shows S-shaped RNE. N = 5. Scale bar = 10 µm. (D) Confocal scan of rim zone showing GFP-ras expressing ezrin morphant clone in a control embryo. N = 2 out of 4 transplanted embryos. Blue arrows point at the basal blebs exhibited by the transplanted morphants cells. Scale bar = 5 µm. (E) Instantaneous slope of the average intensity curves for phalloidin plotted for the basal 20% height of the neuroepithelial volume. The position on the X-axis marks the position along the apicobasal axis. The analysis was performed using the data from Figures 1F, 2C and 5D and Figure 4—figure supplement 3C,D. See Figure 5—source data 3. |