
Fig. 4
- ID
- ZDB-FIG-180103-17
- Publication
- Sidhaye et al., 2017 - Concerted action of neuroepithelial basal shrinkage and active epithelial migration ensures efficient optic cup morphogenesis
- Other Figures
- All Figure Page
- Back to All Figure Page
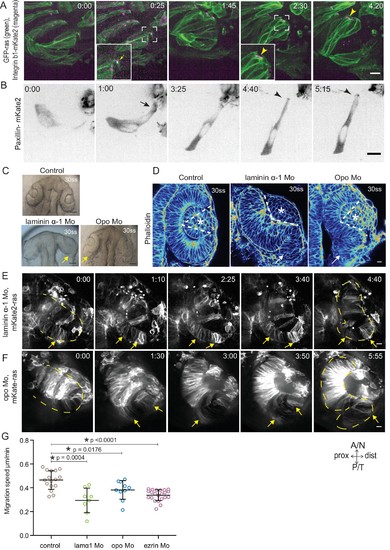
Dynamic cell-ECM attachment of rim cells is important for RNE morphogenesis. (A) Time-lapse imaging of rim zone with mosaic expression of GFP-ras and Integrin-β1b-mKate2. Inlays show enlarged marked area. Arrow indicates the integrin foci during migration. Arrowheads mark the basally enriched stable integrin pool in the RNE cell. Frames from Video 10. N = 4. Scale bar = 10 µm. Imaging started at 17–18 ss, Time in h:min. (B) Timelapse imaging of rim zone with mosaic expression of paxillin-mKate2. Arrow indicates the short-lived paxillin foci. Arrowhead marks the stable basal paxillin localization in the RNE. Frames from Video 11. N = 6. Scale bar = 10 µm. Imaging started at 17–18 ss. Time in h:min. (C) Brightfield images of the dorsal view of 30 ss embryo head. Control (upper), laminin morphant (lower left) and opo morphant (lower right). Arrows mark the epithelial accumulation outside the RNE. Scale bar = 50 µm. (D) Confocal scan of optic cups at 30 ss stained for phalloidin. Control (left), laminin morphant (middle) and opo morphant (right). Arrows mark the epithelial accumulation outside the RNE. Dashed lines indicate the angle of invagination. Asterisk marks the developing lens. Lookup table indicates the minimum and maximum intensity values. Scale bar = 10 µm. (E,F) Time-lapse imaging of RNE morphogenesis in laminin morphant (E) and Opo morphant (F) injected mosaically with mKate2-ras RNA. Arrows mark rim cells that failed to move. Dashed line marks the outline of the developing RNE. Frames from Videos 13 and 14. Time in h:min. Scale bar = 10 µm. Movies started at 16 ss-17 ss. (G) Migration speed of rim cells (Mean ± SD). P values for Mann Whitney test with control: laminin Mo p=0.0004, opo Mo p=0.0176, ezrin Mo p<0.0001. See Figure 4—source data 2. |