
Fig. 4 S3
- ID
- ZDB-FIG-180103-20
- Publication
- Sidhaye et al., 2017 - Concerted action of neuroepithelial basal shrinkage and active epithelial migration ensures efficient optic cup morphogenesis
- Other Figures
- All Figure Page
- Back to All Figure Page
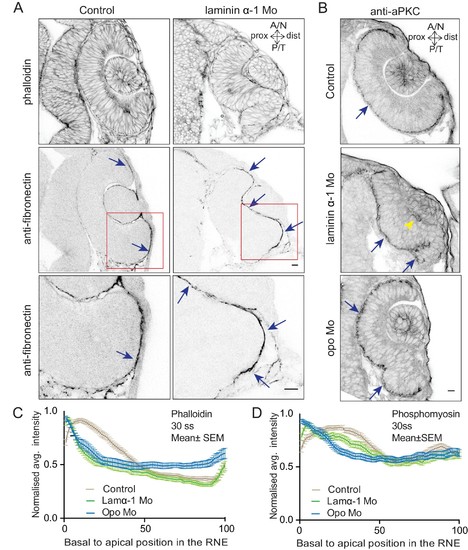
Effect of perturbed cell-ECM attachment on the optic cup. (A) Confocal scan of 30 ss RNE in control (left) and laminin morphants (right) stained for phalloidin and fibronectin. Morphant shows S-shaped RNE and arrows point at enhanced fibronectin staining. The lower panel shows a zoomed image of the area marked by the red box. N = 6. Scale bar = 10 µm. (B) Confocal scan of 30 ss RNE in control (upper), laminin morphant (middle) and opo morphant (bottom) stained for aPKC. Morphants show S-shaped RNE. Blue arrows point at the apical domain marked by aPKC. Yellow arrowhead points at a few delaminated cells in the laminin morphant. N = 5. Scale bar = 10 µm. (C,D) Normalized average intensity distributions of phalloidin (C) and phosphomyosin (D) in tissue volume along the apicobasal axis of the RNE at 30 ss. Mean ± SEM. Control (brown) n = 25, laminin Mo (green) n = 19 and Opo Mo (blue) n = 20. Tissue sections (n); embryos, N = 5. See Figure 4—source data 3 and 4. |